Growing a Temporal Cluster: Membership, Horizontal Scaling, and the Config You Can't Take Back
On this page
- One gossip list, four role rings
- Bootstrap: the visitors' book
- Failure detection: SWIM
- What moves when the ring changes
- Ports, and the firewall rule that works
- What breaks membership, and how it looks
- Wrong broadcastAddress: two clusters of one
- Firewall gaps
- Network partition: shard ping-pong
- A slow node is worse than a dead one
- The rest, briefly
- Is the cluster in sync? A read-only runbook
- What "balanced" actually means
- Equal shard counts are not equal load
- Scaling: what adding a host can and cannot change
- The stages
- N+1 is arithmetic, and not just CPU
- Which move for which symptom
- The N-law: per-host limits multiply
- Role-dedicated machines: when it pays
- Runbooks: five gates and a restart order
- Configuration: six layers, three of them traps
- How dynamic config actually reloads
- A production dynamic config, constrained
- A hot key set wrong: 795 writes per second
- Settings people misjudge
- Decide these once, before the first start
- The safe-change procedure
- What I'd tell myself before adding the second host
TL;DR: Every Temporal role process joins one gossip cluster (ringpop, SWIM over TCP on each role's membership port), seeded from a
cluster_membershiptable in PostgreSQL, and each role builds its own consistent-hash ring from that list. The ring decides who should own a History shard; therange_idstamp in PostgreSQL decides who can write, so membership trouble costs latency, never data. Almost every multi-host failure isbroadcastAddress,bindOnIP, or a firewall that doesn't open every gRPC and membership port between every pair of hosts. A slow node is worse than a dead one, because it makes shards flap. Adding hosts spreads fixed things (shards, partitions) and multiplies every per-host limit, including how hard Temporal may hit PostgreSQL. So pick a cluster-wide budget and divide by N, or use the*Global*keys, and run each host at no more than (N−1) ÷ N of its limit. Finally, config lives in layers:numHistoryShardsand the cluster name are forever, ports and pools need a rolling restart, and some "dynamic" keys (history.shardIOConcurrency, the cache sizes) are only read when a shard or cache is built.
At some point every self-hosted Temporal deployment outgrows one box. The second host is where it stops being "install a binary" and becomes a distributed system. Nothing in the config file lists the other machines, yet within seconds History host A knows it owns shard 17 and host B knows it doesn't. When host C dies, A and B split C's shards without anyone telling them.
When that machinery breaks, it doesn't look like a membership problem. It looks like "Temporal is slow", or "some workflows stall and some don't". And the obvious fix, adding another host, sometimes does nothing and sometimes makes things worse. This post covers three things: how the hosts agree, how to grow the cluster without overloading the database behind it, and which settings you only get to choose once.
If shards, range_id fencing and the four services are new to you, start with the shards post. Here I assume you know that a shard is a box of workflows that must have exactly one owner.
One gossip list, four role rings
Every Temporal process has to keep answering three questions:
- Who else is alive right now, and in which role? That's membership.
- Given that list, who is responsible for X? That's the hash ring: shard X for History, task-queue partition X for Matching.
- What if two of us disagree about (2)? That's fencing, and the database does it, not membership.
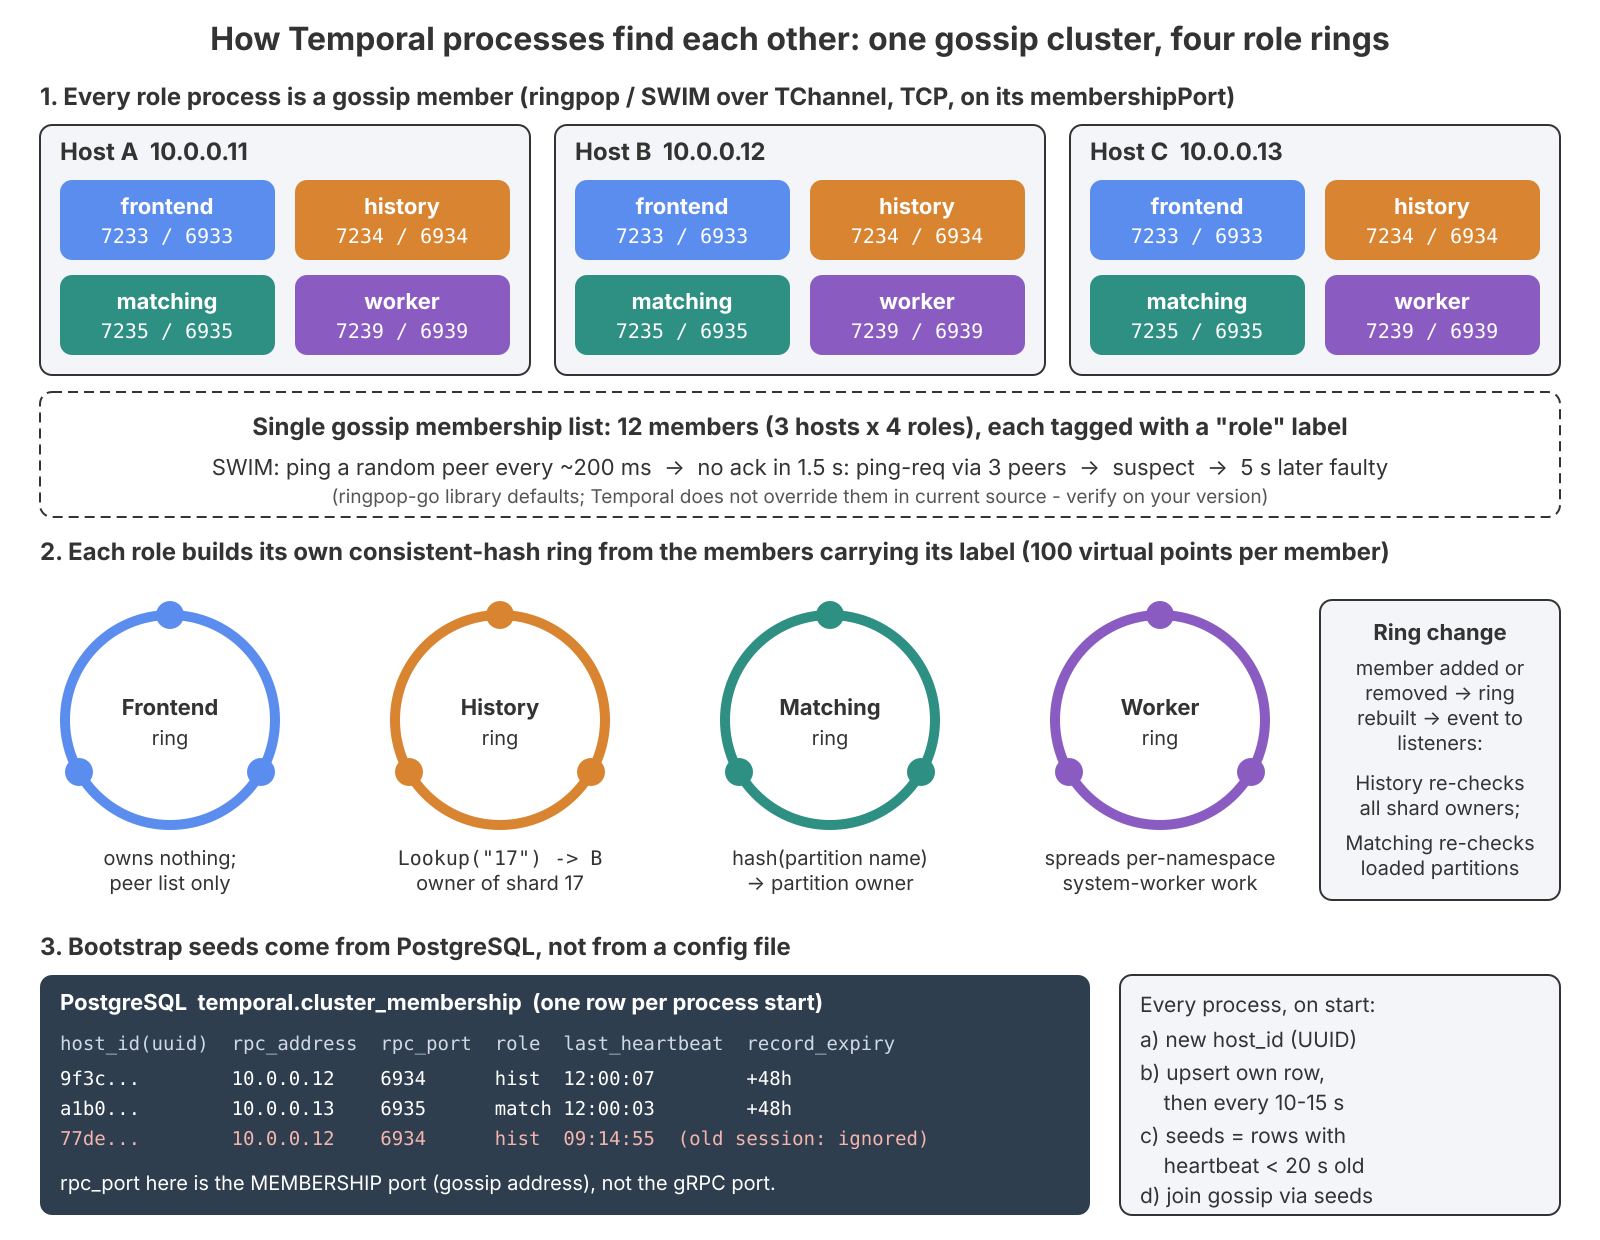
Membership is ringpop, Uber's SWIM gossip library (Temporal maintains a fork), running over TCP on each role's membershipPort. All role processes join one gossip cluster: a History process gossips with Matching, Frontend and Worker processes too. Each member carries a role label and a gRPC-port label, and each role builds its own consistent-hash ring (100 virtual points per member by default) from the reachable members carrying its label. The virtual points are why healthy shard counts per host differ by only a few percent.
The detail that changed how I debug: no table says "shard 17 belongs to host B". Each History host computes Lookup(17) on its own copy of the ring. If two hosts hold different rings, during convergence or a network partition, they compute different owners. The shards row records the last owner, but that's a result of taking the shard, not the source of truth.
The ring decides who should own a shard. The
range_idin PostgreSQL makes sure only one host can actually write.
Bootstrap: the visitors' book
Processes find each other through PostgreSQL. Think of cluster_membership as a visitors' book that everyone signs on arrival and keeps re-signing (from common/membership/ringpop/monitor.go; timings may vary by version):
- New identity. A fresh random
host_idUUID on every process start, even on the same machine and IP. - Sign. Upsert its own row:
rpc_addressandrpc_portare the broadcast address and the membership port (not the gRPC port), withrecord_expiry48 h out. It also prunes up to 10 expired rows. - Keep signing. Re-upsert every 10 s + 0–5 s jitter, stamping
last_heartbeatwith its own clock. - Read. Select rows whose
last_heartbeatis within the last 20 s and use them as seeds. - Join gossip within
global.membership.maxJoinDuration, retrying with backoff and finally exiting fatally. Then set labels and start the rings.
From then on, gossip decides who is alive. The table is a seed list, not the membership. A fresh heartbeat proves the process can write to PostgreSQL. It does not prove peers can reach it over the network. That gap is exactly how a host with a wrong address looks healthy in the table and is missing from everyone's ring.
The read-only query I use:
-- live members (heartbeat in the last 30 s, by the DB clock)
SELECT encode(host_id,'hex') AS host_id, rpc_address, rpc_port, role,
       session_start, last_heartbeat, now() AT TIME ZONE 'UTC' - last_heartbeat AS age
FROM cluster_membership
WHERE last_heartbeat > now() AT TIME ZONE 'UTC' - interval '30 seconds'
ORDER BY role, rpc_address;
The AT TIME ZONE 'UTC' matters: last_heartbeat is timestamp without time zone and the server writes UTC, so on a non-UTC psql session plain now() is off by the zone offset.
Failure detection: SWIM
SWIM detects failures without a coordinator. Each member pings one random member per protocol period. No ack within 1.5 s, and it asks 3 other members to ping the target (5 s), which separates "it's dead" from "my path to it is broken". If nobody reaches it, the target is gossiped as suspect; after another 5 s without a refutation it's faulty and leaves every role ring. These are ringpop-go's library defaults, and Temporal doesn't expose them.
So a hard crash is detected in roughly 5–10 s (inferred from the defaults, so measure it in a failure drill). A graceful stop is much faster: the process calls SelfEvict() and leaves right away, and a Frontend first sets a draining label so peers stop routing to it. When a ring really changes, the resolver logs Current reachable members with the sorted addresses. That's the single best log line for "what does this process think the ring is?"
What moves when the ring changes
History. On every ring change, and every history.acquireShardInterval (default 1 m), the shard controller walks all shard IDs and asks Lookup(shardID) == me? If not but it's loaded, it closes the shard (shard_closed_count). If so and it isn't loaded, it bumps range_id, loads the shard and starts its processors (sharditem_created_count; logs Range updated for shardID then Acquired shard). numshards_gauge reports how many shards the host holds.
With consistent hashing, a join moves about 1 ÷ N_new of the shards (going from 3 to 4 hosts moves ~25%), and a failure moves only the dead host's shards, spread across the survivors.
Matching. A partition's owner is Lookup(partition key) on the Matching ring, fenced by task_queues.range_id. After a ring change, a Matching host waits matching.membershipUnloadDelay (500 ms), then unloads partitions it no longer owns. Waiting pollers get an empty response and re-poll; the backlog lives in PostgreSQL.
Frontend. Nothing moves. Its ring is just a peer list, used for example to divide frontend.globalNamespaceRPS across instances.
During convergence or a partition, two hosts may both believe they own shard 17. The range_id check in every write transaction means at most one of them commits; the other gets ShardOwnershipLostError and drops the shard (the PostgreSQL persistence post has the SQL).
Ports, and the firewall rule that works
| Role | rpc.grpcPort | rpc.membershipPort |
|---|---|---|
| frontend | 7233 (plus httpPort 7243 on newer versions) | 6933 |
| history | 7234 | 6934 |
| matching | 7235 | 6935 |
| worker (internal) | 7239 | 6939 |
These are the upstream sample defaults; your rendered config is the truth. Each role has its own gRPC port and its own membership port, and ringpop runs over TCP, not UDP.
Two kinds of traffic cross between hosts. Gossip is all-to-all across every role on every host. gRPC goes to whichever host owns the shard or partition: Frontend → History and Matching, History → Matching (AddWorkflowTask, AddActivityTask), Matching → History (RecordTaskStarted), History → History for cross-shard calls, and the internal worker back into everything.
So the rule is blunt: between every pair of Temporal hosts, in both directions, allow every gRPC port and every membership port of every role that runs anywhere in the cluster. Only 7233 needs to face clients, ideally through the load balancer. A rule like "History only talks to History" produces partial partitions, and those are much harder to debug than an outage.
What breaks membership, and how it looks
Wrong broadcastAddress: two clusters of one
Two settings decide where a process listens and what address it tells others to dial. Mixing them up is the most common multi-host mistake:
| Setting | Meaning | Common mistake |
|---|---|---|
services.<role>.rpc.bindOnIP | IP to listen on (gRPC and membership). IPv4 only | Auto-detection picks a docker bridge or the wrong NIC |
services.<role>.rpc.bindOnLocalHost | Listen on 127.0.0.1 | Left true from a single-host template, so peers can never connect |
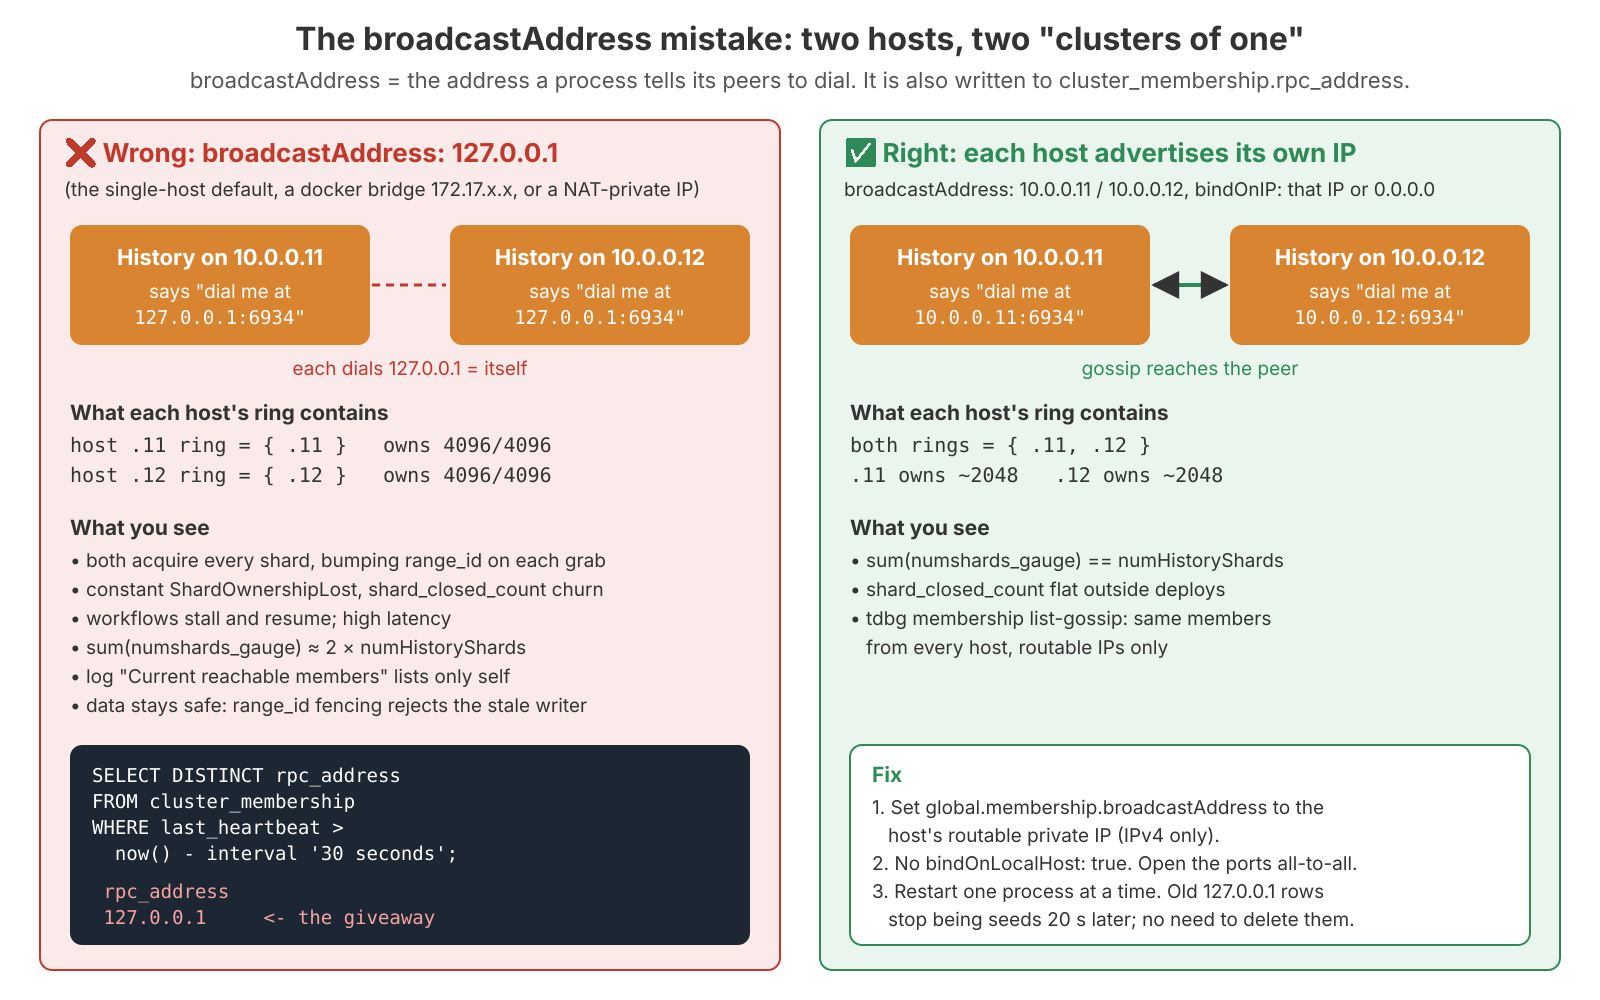
global.membership.broadcastAddress | The IP advertised via gossip and written to cluster_membership.rpc_address | 127.0.0.1, a container-internal IP, a NAT-private IP |
If broadcastAddress is empty, ringpop advertises the listen address, and 0.0.0.0 can't be dialled. So set broadcastAddress explicitly whenever bindOnIP is 0.0.0.0, or whenever you're behind NAT or containers.
The symptom is distinctive once you've seen it. Each host behaves like a cluster of one, and every History host owns every shard: on a two-host, 4096-shard cluster, each reports numshards_gauge = 4096. They fight over every shard through range_id, which gives constant ShardOwnershipLost, high latency, and workflows that stall and resume. Nothing is corrupted, because fencing works, but nothing is fast either. The giveaway:
SELECT DISTINCT rpc_address FROM cluster_membership
WHERE last_heartbeat > now() AT TIME ZONE 'UTC' - interval '30 seconds';
-- 127.0.0.1 or 172.17.x.x here is the whole diagnosis
To fix it, set the routable private IP, drop bindOnLocalHost, and restart one process at a time. The stale 127.0.0.1 rows stop being used as seeds 20 s after their last heartbeat, so there's no need to delete them. A process restarted on the same IP lands in the same ring spot (the position comes from address:port, not host_id), so it gets back roughly the same shards.
Firewall gaps
| What's blocked | What you see |
|---|---|
| Membership port, gRPC open | Same "cluster of one" picture, but with correct IPs in the table |
| gRPC port, membership open | Rings look perfect, but calls to the other host time out. Roughly (N−1) ÷ N of requests fail with Unavailable / DeadlineExceeded, while workflows whose shard sits on the reachable host keep working |
| One direction or one pair | A partial partition: SWIM's indirect pings keep the member "alive" through third parties while direct RPCs fail. Intermittent, pair-dependent symptoms |
Test every port from every host to every other host, and remember that host firewalls and cloud security groups are separate layers:
# run on each Temporal host; PEERS = all the other Temporal hosts
PEERS="host-b host-c"
PORTS="7233 7234 7235 7239 6933 6934 6935 6939"   # adjust to your config
for h in $PEERS; do for p in $PORTS; do
  if nc -z -w 2 "$h" "$p"; then echo "OK   $h:$p"; else echo "FAIL $h:$p"; fi
done; done
Network partition: shard ping-pong
If both sides of a partition can still reach PostgreSQL, each side marks the other faulty, each side's History ring covers all shards, and each takes shards the other holds. Every take bumps range_id, the other side's next write fails, it drops the shard, and its next acquire pass takes it back. Matching does the same with partition leases.
Workflow state is protected; availability isn't. Tasks stall between handovers, and timers and transfer tasks lag. The tell is that different hosts report different member lists, shard_closed_count and service_errors_shard_ownership_lost stay high rather than spiking once, and sum(numshards_gauge) is greater than numHistoryShards. There's no quorum setting that makes one side stand down: fix the network, and if the partition will last, stop Temporal on the minority side.
One related trap isn't a network problem at all: two installations you think are separate, pointed at the same database. They share shards and cluster_membership, so they either silently merge into one Service or fight over every shard forever. Use a separate PostgreSQL database and separate credentials per Temporal Service, so a mis-pointed config can't connect at all.
A slow node is worse than a dead one
A dead node is detected in seconds, and its shards move once. A node that's alive but too slow to answer gossip causes moves again and again.
A long GC pause, CPU starvation (cgroup throttling, a noisy neighbour, PostgreSQL on the same box) or swapping stops the ringpop goroutines from answering in time. Peers mark the node suspect, then faulty, and its shards move away. Then the node recovers, refutes the suspicion, rejoins, and the shards move back. Every move costs a reload, which adds database load, which makes nodes slower. The churn feeds itself, and it shows up on many hosts, not just the sick one.
# membership and shard churn per host (~0 outside deploys)
sum by (instance) (increase(membership_changed_count[10m]))
sum by (instance) (increase(shard_closed_count[10m]))

# writes rejected by the stamp
sum by (instance) (rate(service_errors_shard_ownership_lost[5m]))

# sanity: must equal numHistoryShards (> means contention, < means unowned shards)
sum(numshards_gauge)
Fix the slowness, not the detector: give History memory headroom (see the memory post), move PostgreSQL off the box, fix CPU limits, disable swap. Temporal exposes no setting for the ringpop timeouts anyway, and longer timeouts would also delay detection of real failures.
The rest, briefly
- Stale membership rows are almost never a problem. Bootstrap only uses rows signed in the last 20 s. The old advice to "delete the dead host's rows or the ring keeps waiting" is wrong: the ring is gossip-based.
- Clock skew doesn't affect ownership (
range_idis a logical counter), but a host more than ~20 s off can be invisible at bootstrap, timers fire by the History host's clock, and TLS checks fail. Run chrony on every Temporal and PostgreSQL host. numHistoryShardsmismatch in a new host's config: the server compares it with the stored value. Recent versions logSupplied configuration key/value mismatches persisted cluster metadata...and use the stored value; others refuse to start. Grep startup logs for that message after every host change, because on versions that only warn it hides config drift.
Is the cluster in sync? A read-only runbook
I run this after any membership change and as a periodic check:
# 1. config and listeners: private IP or 0.0.0.0, never 127.0.0.1
grep -nE 'broadcastAddress|bindOnIP|bindOnLocalHost|grpcPort|membershipPort|numHistoryShards' \
  /etc/temporal/config/*.yaml
ss -ltnp | grep -E ':(72|69)[0-9]{2}\b'

# 2. the gossip view from each host: identical member sets, N members per role, routable IPs
tdbg --address host-a:7233 membership list-gossip
tdbg --address host-b:7233 membership list-gossip --role history

# 3. the database view: a row here that's missing from step 2 = reaches PostgreSQL, unreachable by peers
tdbg --address host-a:7233 membership list-db --heartbeated-within 1m

# 4. shard ownership
tdbg --address host-a:7233 shard describe --shard-id 17
Don't try to parse shards.data in SQL; it's a protobuf blob. The only useful column is range_id: if SELECT shard_id, range_id FROM shards WHERE shard_id IN (1,2,3) keeps climbing over a few minutes, shards are being re-taken.
The cluster is in sync when steps 2 and 3 agree on every host, sum(numshards_gauge) equals the shard count exactly, and the churn counters are flat.
What "balanced" actually means
Balanced doesn't mean every number is equal. It means no host reaches its limit long before the others, because the first host to saturate sets the usable capacity of the whole tier (the capacity-chain idea from the capacity planning post). History spreads shards and Matching spreads partitions by consistent hash; Frontend has no ownership, so the load balancer spreads it. Compare the same metric across all hosts of one role at peak, not as a daily average.
Equal shard counts are not equal load
Four History hosts each own ~1024 shards, which is fair by count. But if one shard holds your busiest customer's entity workflow, its owner is drowning while the others idle. The hash spreads workflow IDs, not work: one workflow ID, including every continue-as-new run of it, always lands in one shard. A hot workflow shows up as lock_latency and service_errors_resource_exhausted{resource_exhausted_cause="BusyWorkflow"} on its owner.
When I see "H1 85%, H2 40%, H3 42%, H4 39%", I work through it like this:
- Is the ring OK? Compare
numshards_gauge. If H1 holds far more shards, it's a membership problem. If the counts are similar, it's workload skew. - Host or work? Same request rate but higher CPU means a host problem (steal, throttling, a co-located database, GC). A higher rate means workload skew.
- Which operations?
sum by (operation) (rate(service_requests{instance="H1"}[5m]))against H2. - Which shards? Shard metrics carry no
shard_idlabel, so counttransfer_tasksandtimer_tasksbyshard_idon a replica, then map the hot IDs to owners withtdbg shard describe. - Decide. If one hot workflow is the cause, adding hosts won't help: the shard moves as a whole and can't be split. Fix it in the application (split the entity, rate-limit its signals, continue-as-new).
The test that matters: if the hottest host failed, could the rest absorb its shards and its hot spots without crossing their limits?
Scaling: what adding a host can and cannot change
The obvious move at a busy peak is to add a host. A new History host spreads the shards more thinly. It doesn't create shards, and every keeper still queues at the same PostgreSQL primary. If the database is the slow part, more keepers just make that queue longer.
| Adding a host with… | Changes | Does not change |
|---|---|---|
| History | shards per host, CPU/RAM per shard | number of shards, per-shard serialization, the hottest single workflow |
| Matching | partitions per host | partitions per queue (that's dynamic config) |
| Frontend | requests and long polls per host | per-namespace limits, if you use the global keys |
| any role | the maximum load Temporal is allowed to push into PostgreSQL | how much PostgreSQL can actually take |
Read the last row twice. That gap is where scale-outs turn into outages.
The stages
A cluster grows in stages, and I move to the next one only when a named metric says the current stage is the bottleneck: one all-role process plus PostgreSQL on one box; then PostgreSQL on its own machine (usually the cheapest capacity gain, and a prerequisite for a second host); then two all-role hosts behind a load balancer on 7233 with a PostgreSQL standby; then N all-role hosts; and finally one pool per role. The Temporal docs give a real example of 5 Frontend, 15 History, 17 Matching, 3 Worker. By then PostgreSQL is usually the wall.
N+1 is arithmetic, and not just CPU
When one host dies, the remaining N−1 must carry everything, so each host may run at most at (N−1) ÷ N of its limit at peak: 50% with two hosts, 67% with three, 75% with four.
Two all-role hosts each at 65% CPU at peak look green on every dashboard. Lose one, and the survivor needs 130% of a machine. That cluster isn't healthy. Add a third host (~43% each) or make the hosts bigger.
This applies to every per-host limit too (next section), and to every cache sized per shard: the survivor inherits the dead host's shards, so anything sized per shard grows on it at the exact moment its work doubles.
Which move for which symptom
| Symptom (sustained at peak) | Probably | Do |
|---|---|---|
| All roles busy, PostgreSQL fine | Temporal hosts | add an all-role host, after checking per-host limits × N |
History CPU or heap high, persistence_latency not rising | History | add a History host (if it isn't one hot shard) |
| One History host hot, shard counts equal | hot workflow | fix it in the app |
semaphore_latency{operation="ShardInfo"} large vs persistence_latency | per-shard concurrency | history.shardIOConcurrency 1 → 2, benchmarked (shards post) |
| One task queue slow, workers have free slots | partitions | raise partitions, then add Matching |
| Schedule-to-start high, worker slots ≈ 0 | SDK workers | scale workers |
persistence_latency high on all History hosts, PostgreSQL CPU/IO high | PostgreSQL | scale it vertically, tune; don't add Temporal hosts |
A few of these have traps:
- Matching. Each partition has exactly one owner, so a queue with 4 partitions can occupy at most 4 Matching hosts, and a fifth host gets nothing from it. Raise the hot queue's partitions first (the Matching post).
- Frontend. gRPC multiplexes many calls on one long-lived HTTP/2 connection, so an L4 load balancer keeps existing clients pinned to the old Frontends. If a new Frontend shows near-zero
service_requestsan hour after you add it, that's why. Use an L7 balancer, or shortenfrontend.keepAliveMaxConnectionAgeso clients reconnect. - PostgreSQL.
resource_exhausted_cause="PersistenceLimit"means Temporal's ownpersistenceMaxQPSis throttling, not the database. And read replicas don't help the main store, because Temporal reads its state from the same primary it writes to.
If PostgreSQL CPU is at 92% and someone suggests adding two History hosts because History is "only" at 60%, the answer is no. More History hosts mean more concurrent transactions and a higher allowed total, so the database gets slower, not faster.
The N-law: per-host limits multiply
Most Temporal limits are per host. Each Frontend has its own turnstile and each History host its own budget of database calls. Nothing counts the total.
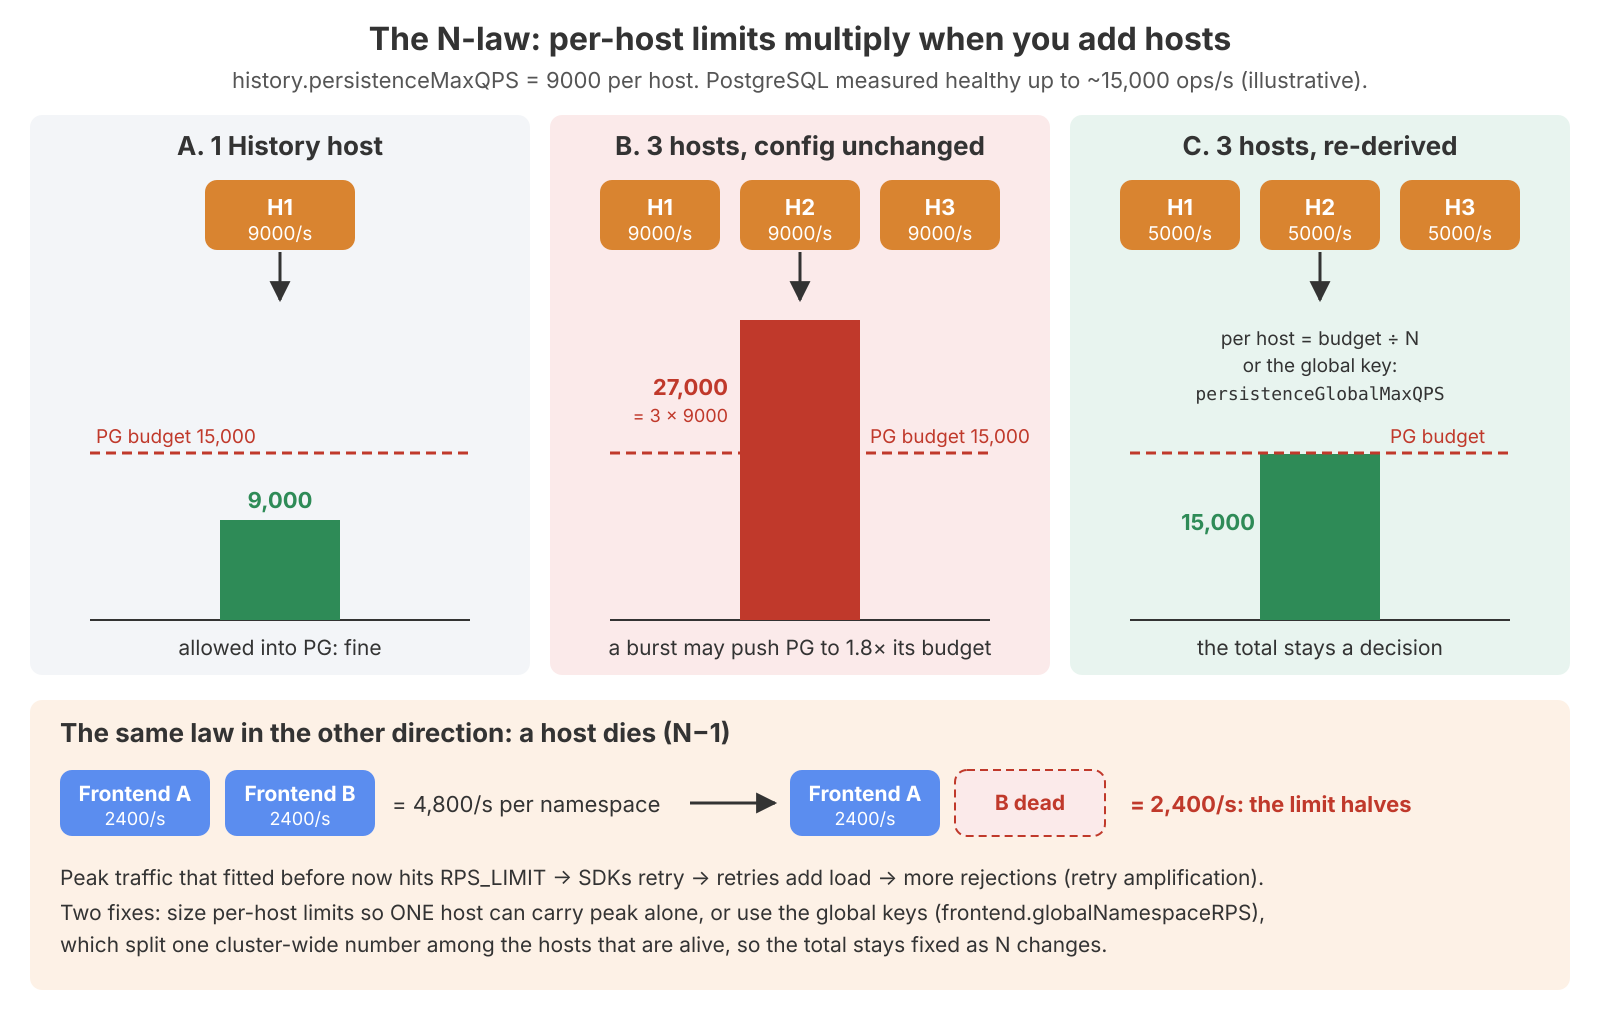
"I set history.persistenceMaxQPS = 9000, so Temporal never sends PostgreSQL more than 9000/s." That's true with one host. With three, each is allowed 9000, so the cluster may send 27,000. Adding hosts silently raised the ceiling on what Temporal may push into the database, and nobody decided it. In a recovery storm (shard reloads, backlog drain) it will use that ceiling.
It also works backwards. Two Frontends at namespaceRPS 2400 give a namespace 4,800/s. Lose one, and the namespace gets 2,400/s: the limit halves at the exact moment the survivor gets all the traffic. Requests that fitted before now hit RPS_LIMIT, the SDKs retry, and the retries add load. (The Frontend post has the full walk-through.)
The fix:
Decide each limit as a cluster-wide budget: what PostgreSQL and your SLOs can take. Then either use the global key, or set the per-host value to
budget ÷ Nand re-derive it every time N changes, in both directions.
The global keys split one number among the hosts that are alive: each Frontend's share of frontend.globalNamespaceRPS is globalLimit ÷ AvailableMemberCount(), including with a single Frontend. The keys that matter (defaults from current source; check your version):
| Key | Scope | Going 1 → N hosts |
|---|---|---|
history.persistenceMaxQPS = 9000 (also matching. 3000, frontend. 2000) | per host | total = N × value; use *.persistenceGlobalMaxQPS or budget ÷ N |
frontend.rps / frontend.namespaceRPS = 2400 | per Frontend | prefer frontend.globalRPS / frontend.globalNamespaceRPS |
history.shardIOConcurrency, matching.numTaskqueue{Read,Write}Partitions | per shard / per queue | independent of N |
history.eventsCacheMaxSizeBytes | per shard | grows on the survivor when a host dies |
sql.maxConns | per process, per datastore (static) | PostgreSQL total = Σ processes × pools |
A worked example, with illustrative numbers. You go from 1 to 3 all-role hosts, and a benchmark showed PostgreSQL stays healthy up to ~15,000 History ops/s. Unchanged, 3 × 9,000 = 27,000/s is allowed, so a burst can push PostgreSQL to 1.8× its budget. The fix is history.persistenceGlobalMaxQPS: 15000 if your version has it, or history.persistenceMaxQPS: 5000 per host. And going back down to 2 hosts with 5,000 each, History may now send only 10,000/s. If peak needs 12,000, you've created self-throttling (PersistenceLimit) that looks exactly like a slow database. Re-derive to 7,500 before you remove the host.
Connections follow the same law. Each role runs its own persistence client with its own pools, so the upper bound is roughly hosts × roles per host × (default.maxConns + visibility.maxConns). Three hosts × 4 roles × (20 + 2) = 264, so max_connections needs to be ≥ ~300 with admin headroom. And an unset maxConns means Go's database/sql allows unlimited open connections, which ends in FATAL: sorry, too many clients already. Set it explicitly.
Role-dedicated machines: when it pays
Separate pools per role are worth it when:
- One role's resource profile dominates. History is memory- and CPU-heavy, Frontend is light and bursty, and Matching is network- and poll-heavy. If History needs 4× the RAM of the others, memory-optimised History machines beat making every host big.
- You want separate deploys and blast radius. Restarting a Frontend moves nothing. Restarting History moves shards. On all-role hosts, every restart moves shards and partitions and drops long polls.
- You're on Kubernetes. The Helm chart already models each role as its own Deployment. Avoid CPU-based HPA on History, though: every scale event moves shards.
For small and medium clusters I'd start with two or three identical all-role hosts. It's the simplest path to availability: one config template, either host can die, and idle Frontend CPU is available to History at a peak, whereas split pools strand headroom. Small pools also fail harder: in a 13-machine split the Frontend pool might be 2 machines, so losing one halves Frontend capacity. Running all-role first also lets you measure each role's real profile before deciding. And splitting roles does nothing when the bottleneck is PostgreSQL. A common middle step is all-role hosts plus a dedicated History pool.
When you do split one process into per-role processes (a systemd template with --service %i works fine), the part people skip is re-deriving memory. One Go heap becomes four heaps under four cgroup limits, and copying a single GOMEMLIMIT four times overcommits memory. Give History most of the RAM and set its GOMEMLIMIT to roughly 80–90% of its unit's memory limit as a starting point. We had one incident where a GOMEMLIMIT too close to the container limit caused an iowait storm (Linux evicted the program's own file pages), and the fix was about two-thirds of MemoryHigh. Re-derive history.hostLevelCacheMaxSize for the new budget as well.
Runbooks: five gates and a restart order
Every procedure (add a host, split roles, remove a host) passes the same gates: a low-traffic window with pollers confirmed healthy beforehand; the change declared in git/IaC; pre-flight re-derivation of every per-host value for the new N, plus the connection budget and ports; proof with specific commands, not "looks fine"; and a soak through one full peak before the next change.
The restart rule I follow: one process at a time, drain Frontends through the load balancer, and restart History last, one host at a time, because a History restart is a shard migration. Never add or restart several History hosts together. Every cache goes cold at once, and the reload burst hits PostgreSQL in one go.
Adding a host. Use the same image, version, numHistoryShards, clusterMetadata and dynamic config as the others. Only the host-specific parts differ:
global:
  membership:
    maxJoinDuration: 30s
    broadcastAddress: "10.0.0.14"      # THIS host's routable private IP, never 127.0.0.1
services:
  frontend: { rpc: { grpcPort: 7233, membershipPort: 6933, bindOnIP: "10.0.0.14" } }
  history:  { rpc: { grpcPort: 7234, membershipPort: 6934, bindOnIP: "10.0.0.14" } }
  matching: { rpc: { grpcPort: 7235, membershipPort: 6935, bindOnIP: "10.0.0.14" } }
  worker:   { rpc: { grpcPort: 7239, membershipPort: 6939, bindOnIP: "10.0.0.14" } }
Add the pg_hba entry, open the firewall both ways with every existing host, deploy the re-derived dynamic config to all hosts first, then start. Prove it:
numshards_gauge                                   # new host ≈ total ÷ N_new
sum(numshards_gauge)                              # must equal numHistoryShards
increase(sharditem_created_count[15m])            # one burst on the new host, then flat
rate(service_errors_shard_ownership_lost[5m])     # brief spike at most
Only then add the new Frontend to the load balancer and confirm it's receiving traffic. Going from 2 to 3 hosts on a 4096-shard cluster moves about 1365 shards, each with a cold cache, so expect a short read burst on PostgreSQL.
Removing a host runs in reverse. Check that N−1 can carry peak and deploy the re-derived per-host values first. Take the Frontend out of the load balancer, wait about one long-poll interval, and stop it. Stop Matching and Worker next, and History last, with SIGTERM, not SIGKILL, so it leaves the ring immediately instead of waiting for SWIM to declare it faulty. Wait for sum(numshards_gauge) == numHistoryShards and flat churn. Membership rows need nothing.
Configuration: six layers, three of them traps
Two stories show the two ways to get configuration wrong.
The knob that can't change. "We're slow, let's change numHistoryShards from 512 to 2048 and restart." The shard count is saved in cluster_metadata_info on first run, and the docs say plainly: "You can't change this value after the first run. The Temporal Service ignores any later changes." If it somehow did change, % 2048 would send almost every workflow to a different shard than the one its rows are filed under. You'd get "workflow not found", not speed.
The knob that did nothing. Someone raises history.shardIOConcurrency from 1 to 4 in the dynamic config. The log says Updated dynamic config, throughput is unchanged an hour later, and they conclude the knob is useless. It isn't. The value is only read when a History host takes a shard, and loaded shards keep their old semaphore until they're re-created.
The same trap bit us on the cache. A small 2 GiB History node ran fine after each restart, then climbed to 100% CPU over about 20 hours, with 0% iowait and PostgreSQL idle. The default history.hostLevelCacheMaxSize of 128,000 entries had slowly filled the Go heap, and the garbage collector was eating 94% of the CPU. The fix was history.hostLevelCacheMaxSize: 16000 plus a restart, because the cache is built when History starts. CPU went from 3.6 cores to 0.3. Without the restart, the same edit would have changed nothing.
So before touching any key, I ask three questions: which layer is it in, what's its scope, and what does it push onto PostgreSQL?
| Layer | Examples | To change it |
|---|---|---|
| Static YAML saved on first run | numHistoryShards, cluster name and ID, failover-version scheme | You can't. New cluster plus migration |
| Static YAML read at start | ports, bindOnIP, broadcastAddress, sql.maxConns, TLS paths | Rolling restart |
| Dynamic config, hot | frontend.rps, *.persistenceMaxQPS, partitions, matching.updateAckInterval | Edit the file; applied within one poll interval |
| Dynamic config, read at init | history.shardIOConcurrency, history.hostLevelCacheMaxSize(Bytes), history.cacheSizeBasedLimit, the events cache keys | Shard reload or History restart, even though it's in the "dynamic" file |
| Namespace metadata (DB) | retention, archival, search attributes | CLI, no restart; some fields are write-once |
| SDK worker options | pollers, slots, sticky cache | Worker redeploy |
How dynamic config actually reloads
The server checks the file's mtime every dynamicConfigClient.pollInterval (minimum 5 s) and re-parses only if it moved. Changed keys are logged as Updated dynamic config with a diff, which is your audit trail. On a parse error, the server logs dynamic config error, keeps the previous values, and sets the gauge dynamic_config_update_failure to 1. Alert on that gauge. Otherwise one typo freezes your config at the old values, and the next "protective" change you push silently does nothing.
To find out whether a key is read at init: since roughly 1.31, key descriptions in common/dynamicconfig/constants.go say "Requires service restart to take effect". On older versions, look at where the key is read: if it's read in a constructor (newContext, NewHostLevelCache), it's read at init. Applying one means confirming the Updated dynamic config log line, then restarting History hosts one at a time, waiting between hosts for the shard spread to return and shard_closed_count to go flat. Do it off-peak, and plan the rollback restart too. (Which History caches are per shard and which are per host on your version is covered in the memory post.)
A production dynamic config, constrained
Values are a list per key, and the most specific matching constraint wins. Illustrative values:
# cluster-wide per-namespace budget: stays correct when Frontends are added
frontend.globalNamespaceRPS:
  - value: 3000
  - value: 600
    constraints:
      namespace: "batch-reports"      # a noisy tenant gets less

# more partitions only for the one hot queue, activity side only
matching.numTaskqueueReadPartitions:
  - value: 8
    constraints: { namespace: "orders", taskQueueName: "payment-activities", taskType: "Activity" }
matching.numTaskqueueWritePartitions:
  - value: 8
    constraints: { namespace: "orders", taskQueueName: "payment-activities", taskType: "Activity" }

# cluster-wide database budget that doesn't grow with host count
history.persistenceGlobalMaxQPS:
  - value: 20000

# READ AT INIT: takes effect only as shards reload (rolling History restart)
history.shardIOConcurrency:
  - value: 2
Partitions are raised for one queue and one task type only; raising the default for everything adds overhead to hundreds of quiet queues. When raising, raise read first (or both together); when lowering, lower write first, drain, then lower read. And I put a comment on every read-at-init key.
A hot key set wrong: 795 writes per second
Hot keys are cheap to change, and just as cheap to get wrong. On a staging cluster, matching.updateAckInterval had been set to 0.5 s instead of the 1 m default. Every partition of every queue rewrote its backlog bookmark row in task_queues twice a second: 795 UpdateTaskQueue writes per second of pure overhead. After the fix it dropped to 8/s.
Do the arithmetic before you blame workflow volume: UpdateTaskQueue/s ≈ active partitions ÷ updateAckInterval. 800/s with the 1-minute default would need 48,000 active partitions, which isn't plausible. With 0.5 s it needs ~400, about 100 queues × 4 partitions, which is exactly what we had. The question to ask is "which single setting would produce this number?"
Settings people misjudge
- Retention applies only to workflows that close after the change. Already-closed workflows keep their old delete time, so cutting 30 days to 7 makes disk usage fall gradually over the next ~30 days (and
dfbarely moves anyway; see the persistence post). - The archival URI is write-once per namespace. The archival state can be toggled.
- Pools (
maxConns,maxIdleConns,maxConnLifetime) are static and need a rolling restart.
Decide these once, before the first start
| Decision | How to decide | If wrong |
|---|---|---|
numHistoryShards | Power of two sized for 3–5 years (the shards post) | New cluster + migration |
| Cluster name | Stable and meaningful (prod-eu1, not active) | Confusing forever once you go multi-cluster |
| Failover-version scheme | Equal failoverVersionIncrement across all future clusters, unique initialFailoverVersion per cluster. Cheap insurance even with one cluster (my judgment) | Can't replicate in or out without a fresh cluster |
| Visibility store | PostgreSQL advanced visibility in a separate database, or Elasticsearch for heavy List queries | Dual-visibility migration |
| Network model | Draw it first: every host reaches every other host's membership + gRPC ports and the database | Ring splits, invisible hosts |
The safe-change procedure
Everything else is tunable. The danger isn't the change itself. It's changing several things at once and then not knowing which one helped or hurt.
- Name the bottleneck and its metric first. "
semaphore_latency{operation="ShardInfo"}p99 is 200 ms against an 80 mspersistence_latency" is a reason. "Temporal is slow" is not. - Find the layer and the scope. If it's per host, compute
value × hostsand compare that with what PostgreSQL can take. - Change it in git, and make sure the same file reaches every host. I compare
sha256sumacross hosts, because a file that differs makes one Matching host think a queue has 8 partitions while another thinks it has 4. - One key at a time, narrowest constraint first.
- Observe across a peak: the metric you named, and what the change pushes onto (usually PostgreSQL).
- Rollback = revert the commit. Read-at-init keys need the restart again.
Metric and key names throughout this post come from current server source (around v1.26–v1.32) and will drift, and exporters may add _total or _bucket suffixes. Confirm on your hosts with curl -s <host>:<metrics-port>/metrics | grep -iE 'shard|membership|dynamic_config'.
What I'd tell myself before adding the second host
- The ring decides who should own a shard;
range_iddecides who can write. Membership trouble costs latency and availability, never data. cluster_membershipis a seed list, not proof of reachability. A fresh heartbeat with no gossip presence means a wrongbroadcastAddress,bindOnLocalHost, or a firewall.- Open every gRPC and membership port of every role between every pair of hosts, both ways. Gossip is all-to-all across roles.
sum(numshards_gauge)must equalnumHistoryShards. Greater means contention or a partition; less means unowned shards.- A slow node is worse than a dead one. Fix the GC, CPU or swap problem, not the detector.
- Equal shard counts aren't equal load. No number of hosts can split a hot workflow's shard.
- Adding hosts never adds shards and never makes PostgreSQL faster. Check the database before every scale-out.
- Per-host limits multiply with N and shrink at N−1. Decide a cluster-wide budget and use the
*Global*keys, or re-derivebudget ÷ Non every host-count change. SetmaxConnsexplicitly. - Run each host at no more than (N−1) ÷ N of its limit at peak. That covers CPU, per-host limits and per-shard caches.
- Restart History last, one host at a time, with SIGTERM. A History restart is a shard migration.
- Split roles when one role dominates or needs its own blast radius, not because it looks tidy.
numHistoryShards, the cluster name and the failover-version scheme are forever. Some "dynamic" keys secretly need a restart. Alert ondynamic_config_update_failure.
Next in the series: failure drills and production architecture: what happens when each part dies, why the recovery burst is the real danger, and why one PostgreSQL primary caps everything.