Temporal Matching and Workers: Task Queues, Partitions, Sticky Queues, Pollers and Slots
On this page
- Why there's a counter in the middle
- What a task queue actually is
- How a task lands on the queue
- Sync match vs backlog
- The sync-match ratio is the health signal
- The handshake: History is the only judge
- The long poll
- Partitions: one shelf, several counters
- Forwarding, and why each partition needs pollers
- Placement and host failure
- Why more Matching hosts don't speed up one queue
- Sticky queues: why a worker restart feels slow
- The ack level and the 795 writes/s incident
- "Worker" means two different things
- Inside your SDK worker: pollers, slots and the cache
- Pollers: few, and at least one per partition
- Slots: size them with Little's law
- Is the wait on the shelf or at the desk?
- Autoscaling workers: not on CPU
- What I'd tell myself before go-live
TL;DR: The Temporal server never calls your workers. Workers long-poll the Matching service through Frontend, and History drops tasks onto named task queues. If a poll is already parked on the partition, the task is handed over in memory (sync match, zero database writes); if not, it's INSERTed into the
taskstable and read back later (backlog). A healthy queue is almost entirely sync match. Each task queue is split into partitions (default 4), each owned by exactly one Matching host, so the partition — not the host — is the unit of parallelism: a sixth Matching host does nothing for a four-partition queue. Sticky queues keep a workflow on the worker that has it cached, which is why a SIGKILLed worker produces a 5–10 s workflow-task stall followed by full replays on everyone else. Inside your worker, pollers only fetch and slots do the work, and a poller only reaches out when a slot is free. So the first question for "Temporal is slow" is always: is the wait on the shelf, or at the desk? Slots at 0 means your workers. Never scale Matching for that.
The most expensive mistake I've watched people make with Temporal is scaling the wrong thing. Schedule-to-start latency goes up, someone says "Matching is overloaded", two more Matching hosts appear, and nothing changes — because the tasks were waiting for our workers, which had every slot full. The reverse happens too: a fleet idling at 5% CPU with one queue backing up, where the fix was a partition count, not a pod count.
Both come from the same gap: not knowing what happens between "History decided an activity should run" and "my function started". This post is that gap — Matching from the server side, then the SDK worker from the application side — with the config keys, the metrics, and the incident that taught me to do arithmetic before listing suspects.
The four services covers the overall shape, and Frontend and History covers the transfer queue that feeds Matching.
Why there's a counter in the middle
History has just recorded "next step: run activity sendEmail". That code lives in your worker processes, not in the server. History can't call the workers: it doesn't know their addresses (NAT, new IPs every deploy, scale to zero), it would have to track their health and capacity, and a slow fleet would back up History's own transfer queue. Workers can't ask History directly either — that hammers the busiest service in the cluster.
So there's a service in the middle. History puts a task on a named task queue and forgets it once Matching acknowledges. Workers make outbound gRPC calls only and wait at the queue. When a task and a waiting worker meet, the task changes hands — a job counter with named shelves. Workers come and go freely, and when they're slow, Matching keeps a durable backlog so History keeps moving.
Matching listens on gRPC 7235 and membership 6935 in the standard sample config (check yours). It talks to Frontend (polls arrive through it), to History (tasks arrive from it, and Matching calls back RecordActivityTaskStarted / RecordWorkflowTaskStarted), and to PostgreSQL.
What a task queue actually is
A task queue is never created. It exists the first time a task is added or a worker polls it, and its identity has three parts:
task queue identity = (namespace_id, task_queue_name, task_type)
                                                       └─ Workflow | Activity | Nexus (newer)
So a worker started with taskQueue: 'email_queue' that registers workflows and activities polls three physical queues: email_queue/Workflow (decisions: "continue this workflow's code"), email_queue/Activity ("run this function once"), and its own sticky queue named like <host>:<uuid>. The workflow and activity queues are fully independent — separate partitions, backlogs, task_queues rows, dynamic-config constraints and metrics. A million-task activity backlog doesn't slow workflow-task dispatch on the same name, though it does slow the workflows waiting on those activities.
One trap: Matching doesn't know what you registered. It hands a task to whichever poll is waiting. If that worker lacks the activity, the attempt fails ("Activity function X is not registered") and is retried on the same queue — possibly onto another worker that lacks it too. Every worker polling a queue must register everything that lands on it. Different apps, different task queues.
How a task lands on the queue
The Matching slice of "workflow code calls executeActivity(sendEmail)":
SDK worker ── RespondWorkflowTaskCompleted [ScheduleActivityTask] ──▶ Frontend ──▶ History (shard owner)

History, one DB transaction:
  append ActivityTaskScheduled + update mutable state + INSERT transfer_tasks(ActivityTask)

History transfer queue processor:
  matching client picks a WRITE partition (say P2), looks up its owner on the ring
  └─ AddActivityTask(email_queue/P2, scheduleToStartTimeout) ──▶ Matching

Matching, partition P2:
  poll parked here?  yes ─▶ RecordActivityTaskStarted on History ─▶ task in poll response ─▶ OK (sync match)
                     no  ─▶ INSERT INTO tasks ─▶ OK (backlog)

History acks the transfer task
The task is durable in History before Matching sees it — the transfer_tasks row commits with the event. If Matching is down, History's transfer queue keeps retrying AddActivityTask; nothing is lost, the task is just late, and that lateness is schedule-to-start latency. History acks only after Matching says OK, and OK means exactly "handed to a poller" or "persisted in tasks". Workflow tasks take the same path via AddWorkflowTask, except History may try the sticky queue first.
Sync match vs backlog
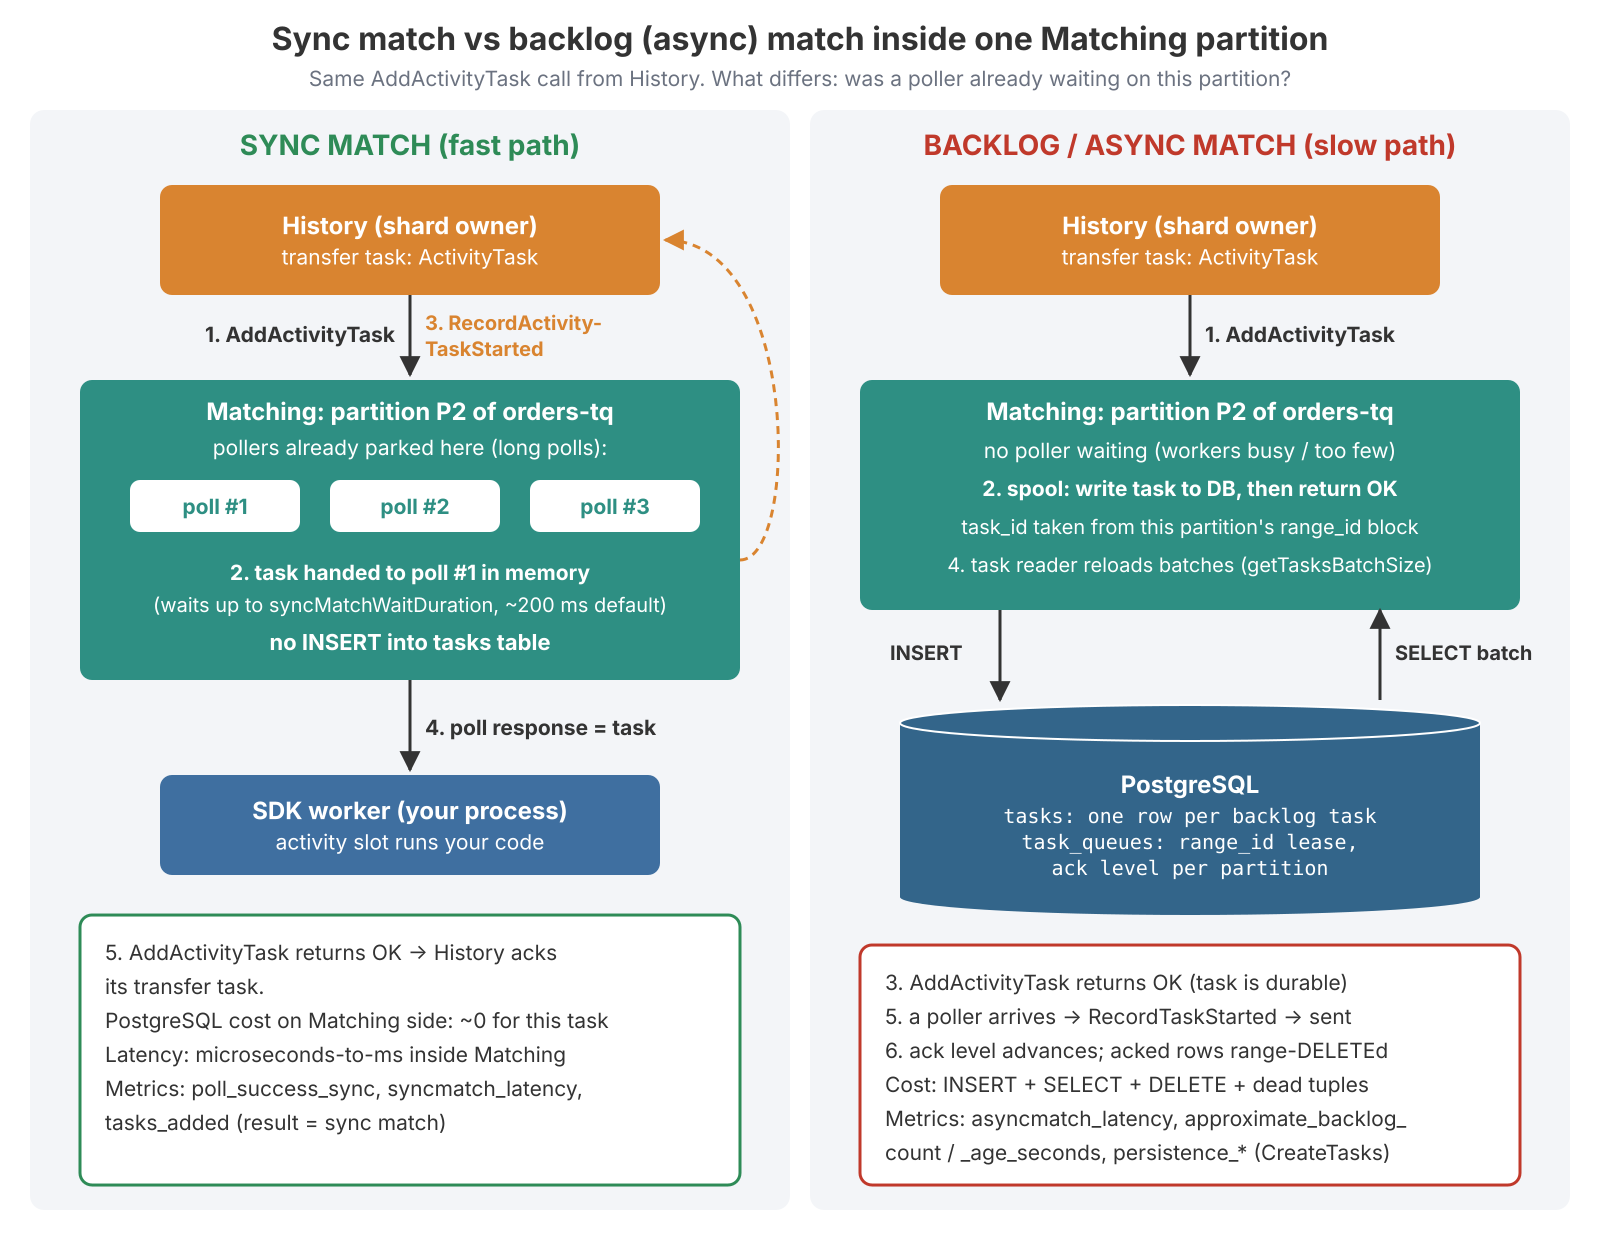
Sync match. The partition offers the task to a parked poll, waiting up to matching.syncMatchWaitDuration (200 ms on current versions). If a poll takes it, Matching does the History handshake, the poll returns the task, and AddTask returns OK. No row is written to tasks. Metrics: poll_success_sync, syncmatch_latency.
Backlog. If no poll takes it, Matching spools it:
- A task ID comes from the partition's current ID block, granted per
range_id— the same "stamp that only goes up" fencing as History shards. INSERT INTO tasks (range_hash, task_queue_id, task_id, data, data_encoding), one protobuf row per task.AddTaskreturns OK.- The partition's task reader pulls rows into memory in batches of
matching.getTasksBatchSize(default 1000), and hands them to polls as they arrive. - The partition tracks an ack level — "everything up to task X is done" — saved every
matching.updateAckInterval(default 1 minute) in itstask_queuesrow. Rows below it are range-deleted.
The task_queues row is also the partition's lease:
-- verify with \d task_queues on your version
CREATE TABLE task_queues (
  range_hash    BIGINT NOT NULL,
  task_queue_id BYTEA  NOT NULL,   -- namespace UUID bytes + partition name + type byte
  range_id      BIGINT NOT NULL,   -- the lease / fencing token
  data          BYTEA  NOT NULL,   -- protobuf: ack level, expiry, kind ...
  data_encoding VARCHAR(16) NOT NULL,
  PRIMARY KEY (range_hash, task_queue_id)
);
A host loading a partition bumps range_id with a conditional update, and every later backlog write is conditioned on it. If another host has bumped it since, the write fails with "task queue ownership lost" and this host unloads the partition. During ring churn two hosts can believe they own a partition, but only one can write its backlog — the same pattern as shard fencing. Newer servers may also use tasks_v2 / task_queues_v2 for fairness scheduling; run \dt task* before assuming tasks is the only backlog table.
The sync-match ratio is the health signal
| Sync-match ratio | Meaning | PostgreSQL cost per task (Matching) |
|---|---|---|
| ~100% | Pollers outnumber tasks | ~0 |
| Falling | Workers can't keep up, or polls sit on different partitions than tasks | INSERT + SELECT + DELETE + dead tuples |
| ~0%, backlog growing | Workers saturated or absent | full churn; tasks bloats, autovacuum works hard |
# Sync-match ratio per task queue (label names version-dependent: check /metrics first)
sum by (namespace, taskqueue) (rate(poll_success_sync[5m]))
/ clamp_min(sum by (namespace, taskqueue) (rate(poll_success[5m])), 1)
The handshake: History is the only judge
A backlog can hold stale tasks: after a crash the new owner re-reads from an old ack level and may offer a task twice, and a workflow may have been cancelled while its task sat on the queue. Recording every handout durably in Matching would make every sync match a DB write, defeating the point.
So Matching records nothing. Just before giving a task to a poll, it calls Record*TaskStarted on History, which checks mutable state, writes "started" if the task is still valid, and replies. Only then does the poll return. Duplicates are harmless — History refuses, Matching drops the task (tasks_dropped) and offers the next one. Matching can lose its in-memory state freely. And the one gap — "started" in History but the poll response lost in a crash — is closed by the activity's start-to-close timeout or the 10 s workflow task timeout, which is why every activity needs a sensible StartToCloseTimeout (timeouts post).
The cost: every successful poll is one extra RPC into History, and it's a mutable-state update that takes the per-workflow lock and a shard I/O slot. A slow History therefore slows dispatch too — service_latency{operation="RecordActivityTaskStarted"} on History rises together with schedule-to-start.
The long poll
A worker doesn't ask "any work?" once a second. It asks once and keeps standing there for up to a minute.
SDK poller ──PollActivityTaskQueue("email_queue")──▶ load balancer ──▶ any Frontend host
Frontend ──(matching client: pick READ partition, ring lookup)──▶ owner of /_sys/email_queue/1
Matching parks the poll on partition 1; the Frontend goroutine waits on the gRPC call- Every poll goes through Frontend, so a poller storm shows up first as Frontend
ConcurrentLimitrejections:frontend.namespaceCountdefaults to 1200 concurrent long polls per namespace, per Frontend host, per API. - A poll is one unary gRPC call held open — a parked goroutine and an HTTP/2 stream on each of two hops. Nothing spins.
- If nothing arrives within
matching.longPollExpirationInterval(1 minute), Matching returns an empty response andpoll_timeoutsgoes up. Not an error; the SDK re-polls. - The SDK's poll deadline is a bit longer than the server window (~70 s in the Go SDK; verify yours). Every LB and proxy in front of Frontend needs an idle timeout above ~70 s, or you get
temporal_long_request_failureexactly at the LB timeout. I start at 2 minutes.
Idle polls cost almost no CPU and never touch PostgreSQL. What they cost is concurrency: Frontend's per-namespace count, Matching goroutines, file descriptors, LB connection tables. 200 workers × 50 pollers × 2 types is 20,000 parked polls — Frontend starts rejecting, and nothing got faster because tasks/s didn't change.
Partitions: one shelf, several counters
If a queue lived on one Matching host, all its adds, polls and backlog writes would hit one host and one lease row, and losing that host would pause the queue. Same problem as History, same fix: split it. Every queue (per type) has 4 read and 4 write partitions by default (matching.numTaskqueueReadPartitions / matching.numTaskqueueWritePartitions, dynamic and per-queue), each with its own owner, backlog rows, lease row and in-memory matcher.
partition 0 (root)   RPC name = "email_queue"
partition 1..N-1     RPC name = "/_sys/email_queue/<id>"
sticky               RPC name = the sticky queue name (never partitioned)
The SDK knows nothing about this. The matching client inside Frontend (polls) and History (adds) picks a partition at random (or load-aware, depending on version).
Write partitions are where History adds; read partitions are where polls spread. Keep them equal in steady state, and read ≥ write at every moment during a change. Growing 4 → 8: raise read first. Shrinking 8 → 4: lower write first, wait until partitions 4–7 drain to zero backlog, then lower read — do it the other way and tasks already spooled on 4–7 are stranded.
Forwarding, and why each partition needs pollers
With 4 partitions and one idle poll, the poll waits on P3 and the next task lands on P1. So partitions form a tree: a child with an unmatched poll or task forwards it to its parent, and the root (P0) is where stragglers meet. With 20 or fewer partitions every child's parent is P0 (matching.forwarderMaxChildrenPerNode, default 20).
Forwarding is rate-limited on purpose — 1 outstanding poll, 1 outstanding task and 10/s per partition by default — and if the parent can't match a forwarded task, the child spools it. It's a low-traffic fallback, not a throughput path. So with 16 read partitions and 8 pollers across the fleet, half the partitions have no poll at any moment and their tasks crawl through forwarding while your workers sit idle. Pollers across the fleet ≥ read partitions, with margin.
Placement and host failure
Every partition of every queue is hashed independently onto the ring of live Matching hosts:
routing key = "<namespaceID>:<partition RPC name>:<taskType>"
owner       = matchingRing.Lookup(routing key)
There's no ownership table in PostgreSQL; task_queues only shows which partitions exist and how often they've changed hands:
-- Read-only. A range_id that climbs quickly = the partition is re-leased often (ring churn, restarts).
SELECT encode(substring(task_queue_id from 17), 'escape') AS partition_and_type, range_id
FROM task_queues
ORDER BY range_id DESC
LIMIT 20;
When a Matching host dies, its parked polls fail and SDKs re-poll; its in-memory buffer is gone but the rows are still in tasks. For the seconds until gossip notices, adds routed to it fail and History's transfer queue retries them. Then only that host's partitions rehash to survivors, each new owner bumps range_id and reloads from the saved ack level (redispatching a few tasks that History refuses), and you see a schedule-to-start spike about as long as detection plus reload. Nothing durable is lost; sync-matched-but-undelivered tasks come back via timeouts. Adding a host is the mirror image — about 1 ÷ N of all partitions move — so on a busy cluster add hosts one at a time, off-peak. Membership itself is its own post.
Why more Matching hosts don't speed up one queue
One partition, one host. A four-partition queue can use at most four hosts. Each partition has three ceilings — one host's CPU, one in-memory matcher, one lease row and backlog key range — so a queue's throughput ≈ partitions × per-partition ceiling.
Temporal doesn't publish that ceiling. The figure usually quoted is on the order of ~100 tasks/s per partition (some say a few hundred), and it depends on CPU, payload size, sync-match ratio and DB latency. I use it as a conservative start — partitions ≈ peak tasks/s ÷ 100, minimum 4 — then benchmark: push load until the queue's schedule-to-start p99 rises while worker slots are free and its Matching owners are under 70% CPU.
Symptoms of too few partitions: that queue's asyncmatch_latency and approximate_backlog_count rise while worker slots are free; the 1–2 hosts owning its partitions are hot and the rest cool; task persistence_latency is normal; adding hosts didn't help.
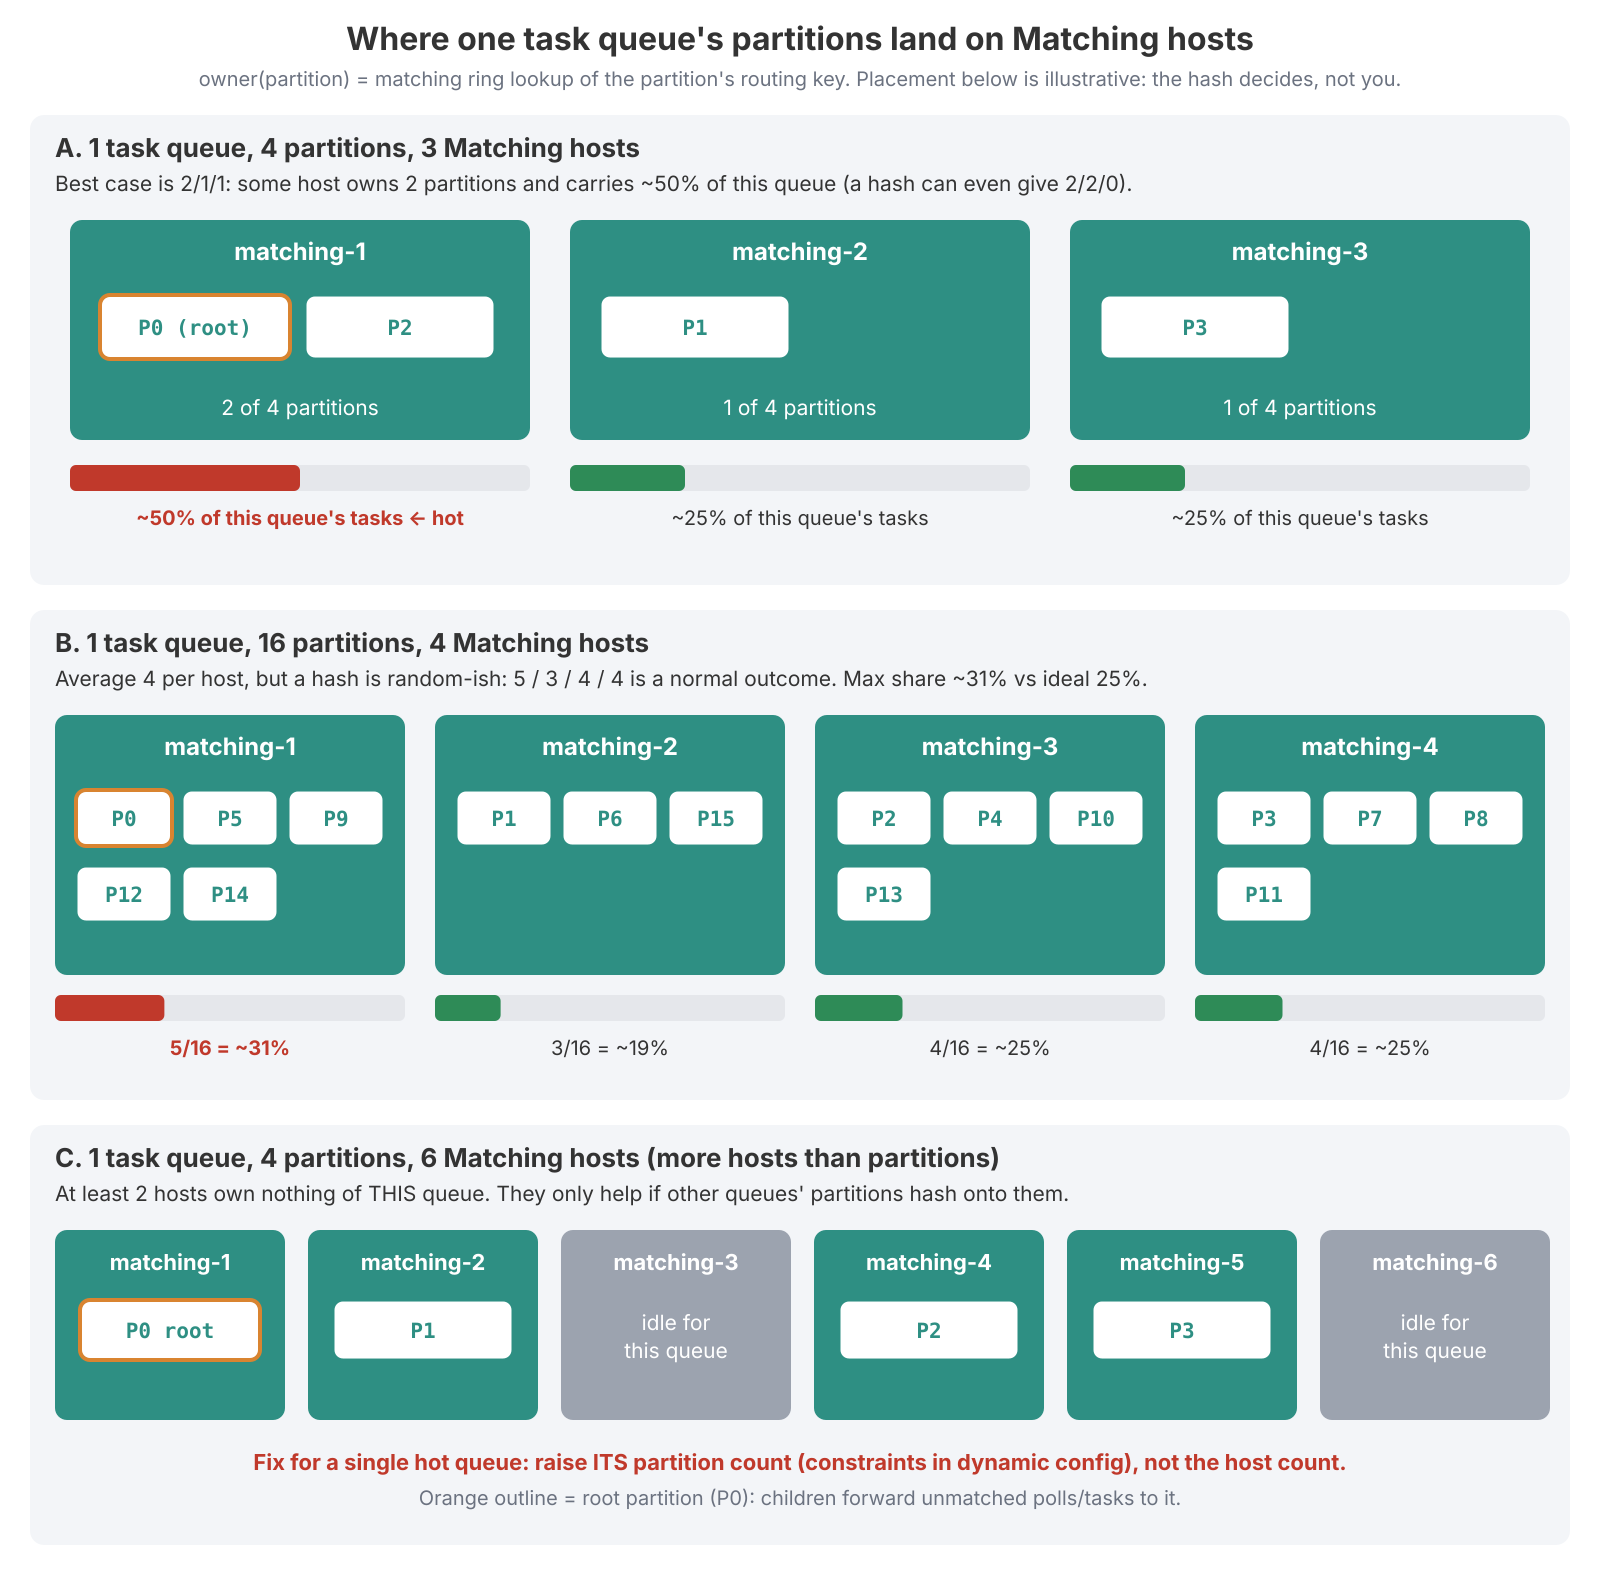
Placement is a hash, not a plan, and that changes the math. Illustrative numbers for one hot queue at 400 tasks/s, from a quick uniform-random simulation:
| Setup | Hottest host share (typical) | Per-partition load |
|---|---|---|
| 4 partitions / 3 hosts | 50% at best; 75% about 30% of the time | 100 t/s |
| 4 partitions / 6 hosts | ~3 hosts own none of this queue | 100 t/s |
| 16 partitions / 4 hosts | ~31–44% (exact 4/4/4/4 only ~1.5% of the time) | 25 t/s, ~4× headroom |
| 64 partitions / 4 hosts | ~30–34% | ~6 t/s |
Smaller pieces average out. My working rule for a hot queue is partitions ≥ 2 × the Matching hosts I want serving it — an operational starting point, not a Temporal rule. Idle hosts only appear in practice when one or two queues dominate; a real cluster has sticky queues, temporal-sys-* queues and other namespaces spread everywhere.
Raise partitions on the hot queue only:
# dynamicconfig/production.yaml
matching.numTaskqueueReadPartitions:
  - value: 16
    constraints:
      namespace: "payments"
      taskQueueName: "orders-tq"
      taskType: "Activity"
  - value: 4
matching.numTaskqueueWritePartitions:
  - value: 16
    constraints:
      namespace: "payments"
      taskQueueName: "orders-tq"
      taskType: "Activity"
  - value: 4
Dynamic config reloads without a restart, but it must be the same file on every host, or History adds to 16 partitions while some Frontends poll 4. And don't raise it globally "to be safe": every partition is another lease row and ack-level writer, and on quiet queues the few polls get spread so thin that the sync-match ratio drops and more tasks spool.
Sticky queues: why a worker restart feels slow
To make each decision a worker replays the workflow function against its history (determinism and replay). For a 2,000-event workflow, doing that every step burns CPU and makes History ship the whole history every time. So the SDK keeps recent workflows in memory — the sticky cache (maxCachedWorkflows in TypeScript, worker.SetStickyWorkflowCacheSize in Go) — and History routes the next task to that worker's personal sticky queue:
- Completing a workflow task, the worker tells History its sticky queue name and a sticky schedule-to-start timeout (default 5 s in Go, 10 s in TypeScript).
- History records it in mutable state and sends the next workflow task to that sticky queue.
- Sticky queues have one partition and no forwarding. If nobody has polled one recently, Matching answers
StickyWorkerUnavailableat once and History uses the normal queue. - If a sticky task sits unpicked past the timeout — the worker is overloaded, or just died and its queue is still loaded — History moves it to the normal queue, where any worker can take it at the cost of a full replay.
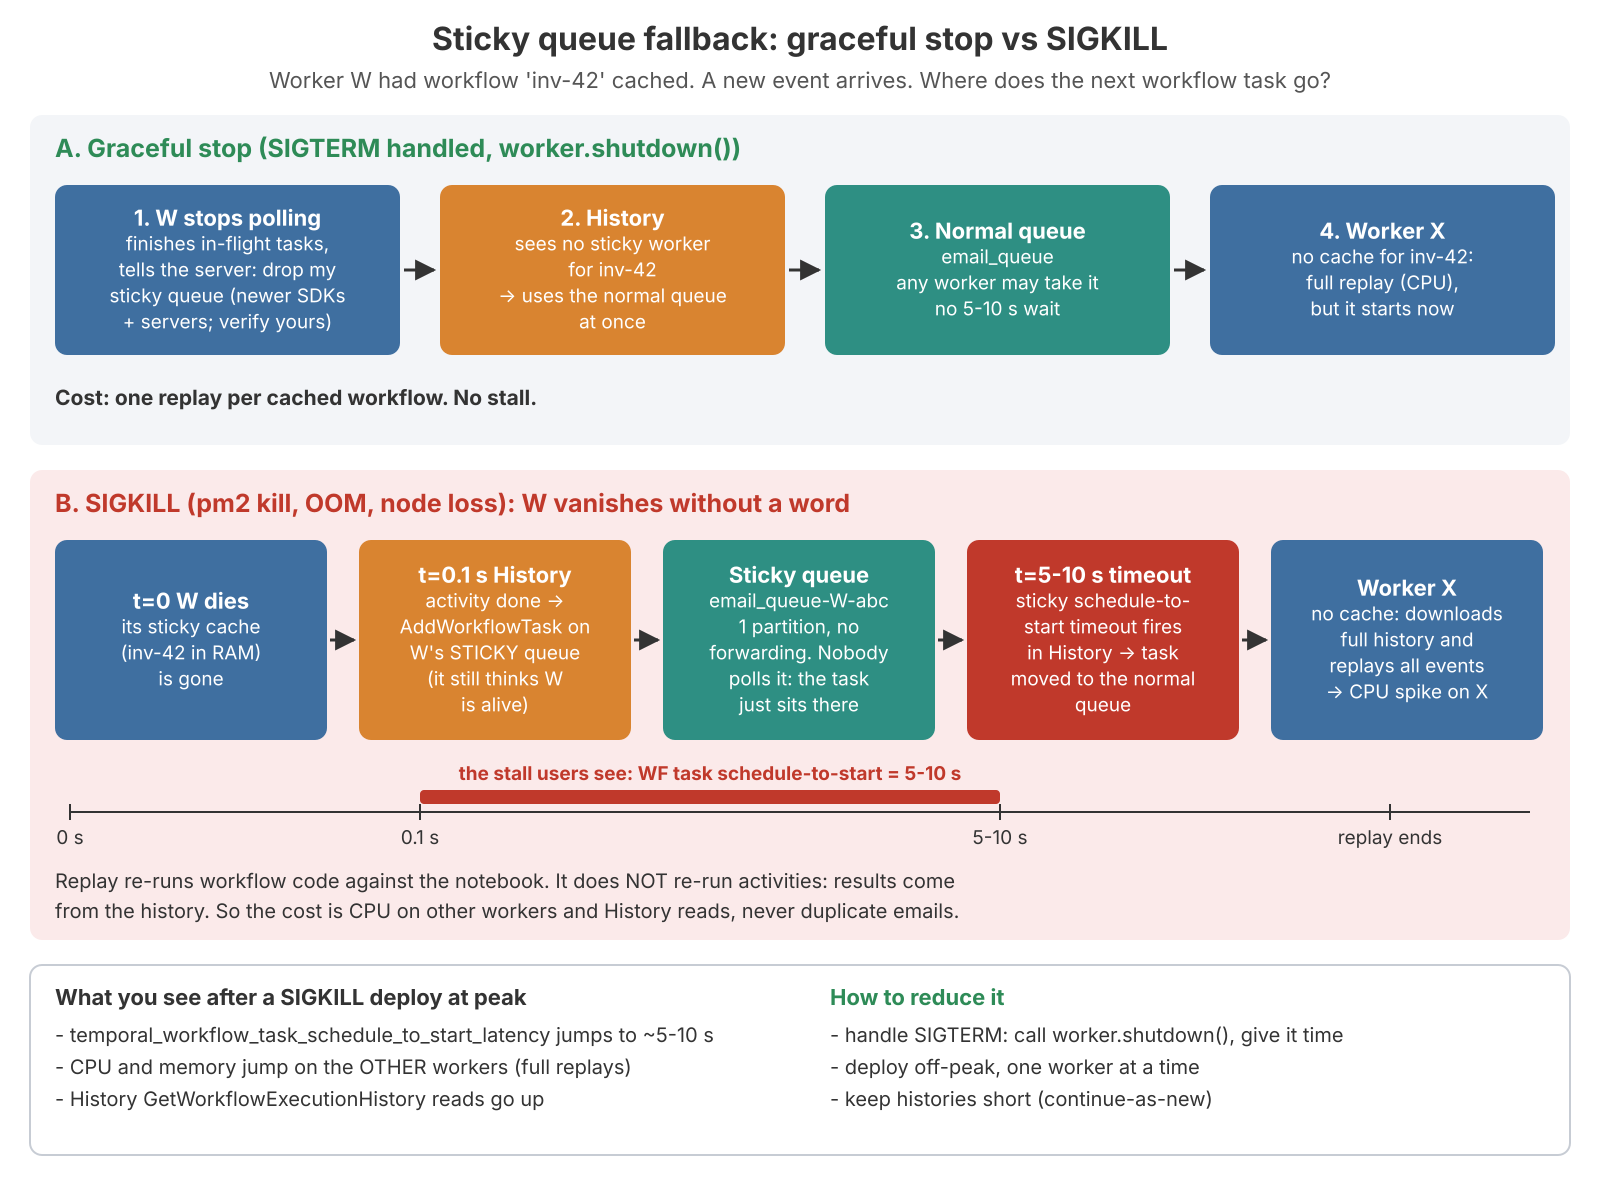
Step 4 is what bites. SIGKILL a worker with a warm cache and every workflow it held gets its next task sent to a queue nobody polls, waits out the 5–10 s timeout, then replays in full somewhere else. We saw exactly this on one of our worker fleets: every restart was followed by a burst of slow workflow tasks and a CPU spike on the survivors, and the more workflows cached at the moment of the kill, the bigger the cascade — so peak-hour deploys hurt most. Replay re-runs workflow code, not activities (their results come from history): the cost is CPU and History reads, never duplicate emails.
The fix is graceful shutdown. A worker that stops properly stops polling, finishes in-flight work and tells the server to drop its sticky queue (newer SDKs and servers do this with ShutdownWorker; check your changelog), so tasks go to the normal queue immediately. Under pm2 that needs time: the TypeScript SDK handles SIGINT/SIGTERM, but pm2 sends SIGKILL after kill_timeout — 1600 ms by default (verify your version). If kill_timeout is shorter than your shutdown, every deploy is a SIGKILL. Then deploy off-peak, one worker at a time, and keep histories short with continue-as-new.
A fleet that restarts constantly — crash loops, aggressive scale-in, pm2 max_memory_restart — turns every workflow task into a replay: higher temporal_workflow_task_execution_latency, more GetWorkflowExecutionHistory on History, a falling temporal_sticky_cache_hit ratio. A worker problem that looks exactly like server load.
The ack level and the 795 writes/s incident
Each partition saves its ack level every matching.updateAckInterval, default 1 minute. Saving often means fewer redispatched tasks after a crash, but every save is a row update. Saving rarely means more redispatches — harmless, because History refuses them. Duplicates are cheap and write storms aren't, so the default leans towards rarely.
On a staging cluster someone had set it to 0.5 s. Every active partition rewrote its task_queues row twice a second, and PostgreSQL showed 795 UpdateTaskQueue writes/s of pure overhead. Back at the default: 8/s.
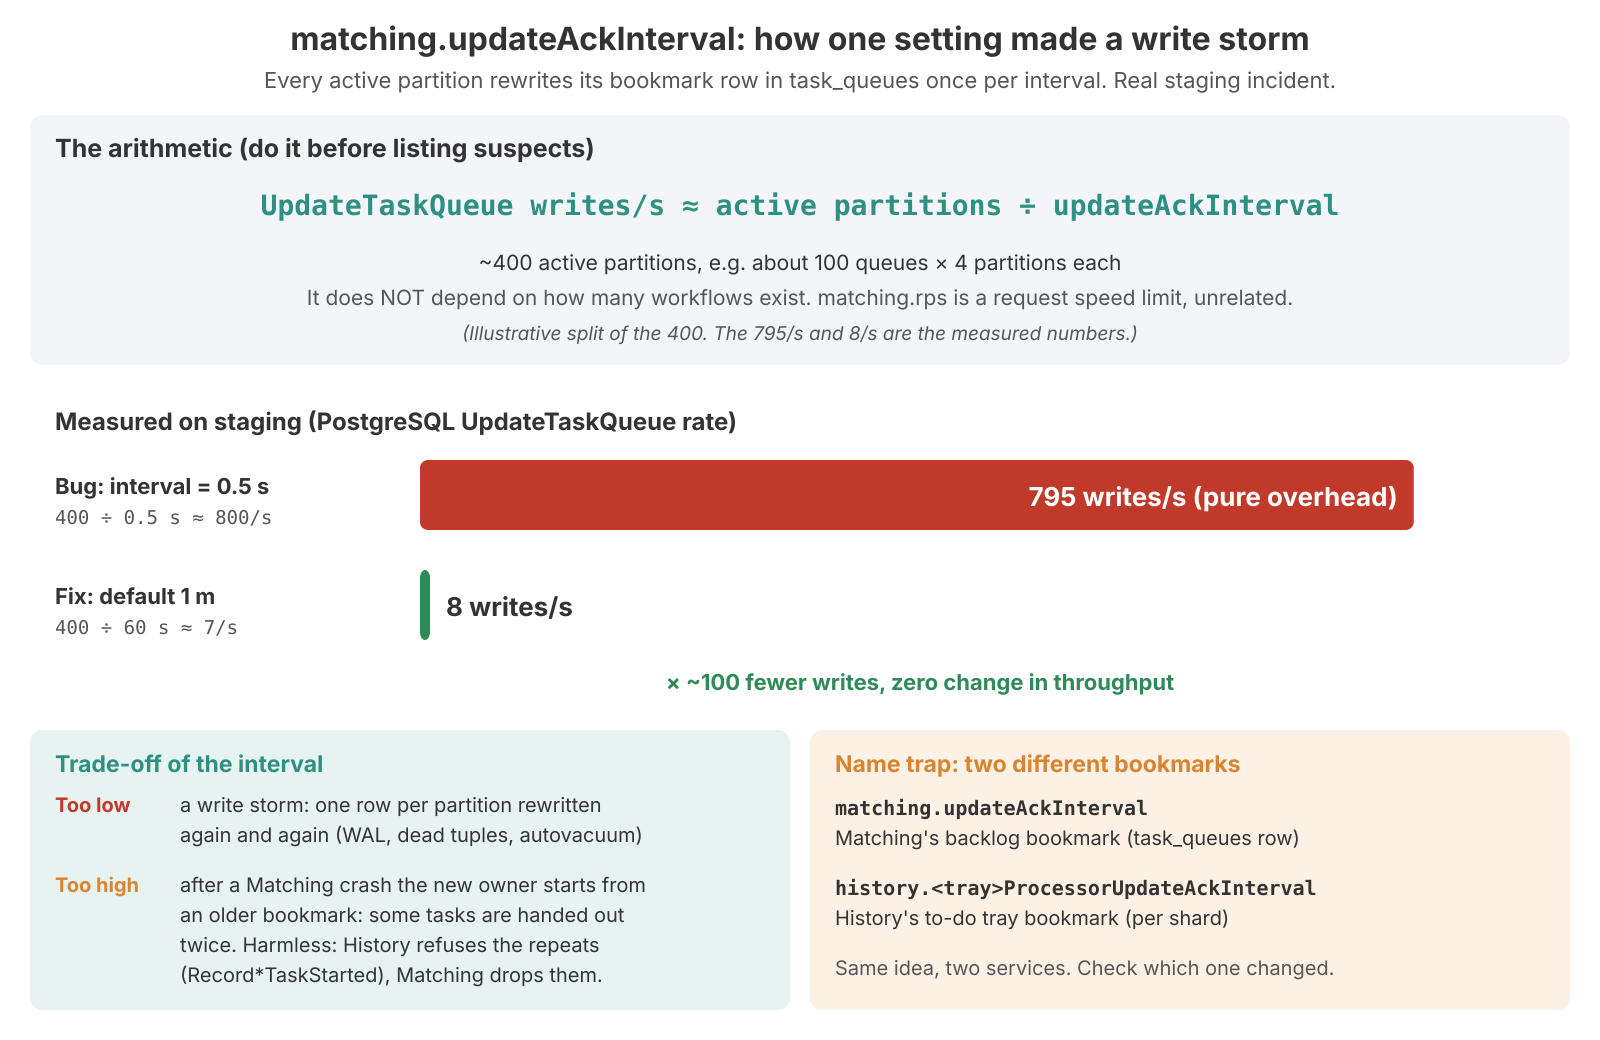
The habit I took from it: do the arithmetic before listing suspects. "800 UpdateTaskQueue/s, we have too many workflows":
UpdateTaskQueue/s ≈ active partitions ÷ updateAckInterval

800/s at the 1 min default -> 800 × 60  = 48,000 active partitions   not plausible
800/s at 0.5 s             -> 800 × 0.5 = 400 ≈ 100 queues × 4       plausible
The rate depends on active partitions and the interval, not on workflow count. matching.rps is a request limit and irrelevant here. And mind the near-name: history.<tray>ProcessorUpdateAckInterval is History's per-shard bookmark. Same idea, different service — a storm on task_queues is Matching, on shards is History. To measure without metrics:
-- Run twice, 60 s apart; the n_tup_upd difference on task_queues ÷ 60 = ack-level/lease writes/s
SELECT relname, n_tup_ins, n_tup_upd, n_tup_del, n_dead_tup, last_autovacuum
FROM pg_stat_user_tables
WHERE relname IN ('tasks', 'task_queues', 'tasks_v2', 'task_queues_v2');
Matching's PostgreSQL traffic is also capped by matching.persistenceMaxQPS (3000 per host on current docs; older material says 9000). Hitting it shows as PersistenceLimit throttling; raising it just moves load to the database. The real fix for backlog churn is getting back to sync match. tasks bloat and autovacuum live in the persistence post.
"Worker" means two different things
Now the other side of the counter. "The Temporal workers are down" can mean two unrelated things:
| Internal worker (server role) | SDK worker (your app) | |
|---|---|---|
| What it is | temporal-server start --service=worker | a process you build with an SDK |
| Whose code / queues | Temporal's system workflows on temporal-sys-* | yours, plus sticky queues |
| In the membership ring? | yes | no — a gRPC client of Frontend |
| If all replicas die | system jobs pause; your workflows keep running (except things like Schedules) | your workflows stop progressing; tasks pile up in Matching |
Scaling the internal worker does nothing for your schedule-to-start; scaling your SDK workers does nothing for a stuck namespace deletion. Always say which.
The internal worker is Temporal running its own background jobs as Temporal workflows on the Go SDK, so they get retries and durability for free. On PostgreSQL the important ones are the task queue scanner (SQL stores only — it deletes expired tasks rows and idle task_queues rows, so Matching's tables don't grow forever), the history scanner (orphan history branches), batch operations (temporal workflow terminate --query ..., throttled by worker.batcherRPS, 50 per job), namespace deletion, parent-close processing for large fan-outs, and Schedules on temporal-sys-per-ns-tq (worker.schedulerNamespaceStartWorkflowRPS, 30 per namespace). The executions scanner isn't supported on SQL. A newer Scheduler that runs inside History exists on current main but isn't GA — check where your Schedules actually run.
One correction to my own early notes: retention deletion isn't the internal worker's job. When a workflow closes, History creates a DeleteHistoryEvent timer task on its shard and runs it itself. If retention lags, look at History's timer queue, not the worker role.
Run at least two replicas so a node loss doesn't pause Schedules; Temporal's docs cite a production deployment with "5 Frontend, 15 History, 17 Matching, and 3 Worker Services". And the trap: its embedded SDK clients are Frontend clients. Enable mTLS and an authorizer on Frontend without giving the system worker its own cert and role, and it fails silently — Schedules stop firing, scanners stop running, your own workflows look fine. Grep its logs for PermissionDenied, or route it via the internal-frontend role. I page on zero internal-worker replicas for 5 minutes and warn on any temporal-sys-* backlog older than 15 minutes; Temporal publishes no thresholds, so those are my starting points.
max by (namespace, taskqueue) (approximate_backlog_count{taskqueue=~"temporal-sys-.*"})
sum by (namespace) (rate(schedule_missed_catchup_window[15m]))
Inside your SDK worker: pollers, slots and the cache
An SDK worker holds no authoritative state, so it can be killed and scaled like any stateless service — provided it shuts down gracefully. Inside it are pollers (each an outstanding long poll; they only fetch), slots (permission to run one task concurrently, separately for workflow tasks, activities and local activities), and the sticky cache.
The rule that makes everything else make sense: a poller only reaches out if a slot is free. Think hands and desks — grabbing a job takes milliseconds and doing it takes much longer, so a few hands keep many desks fed.
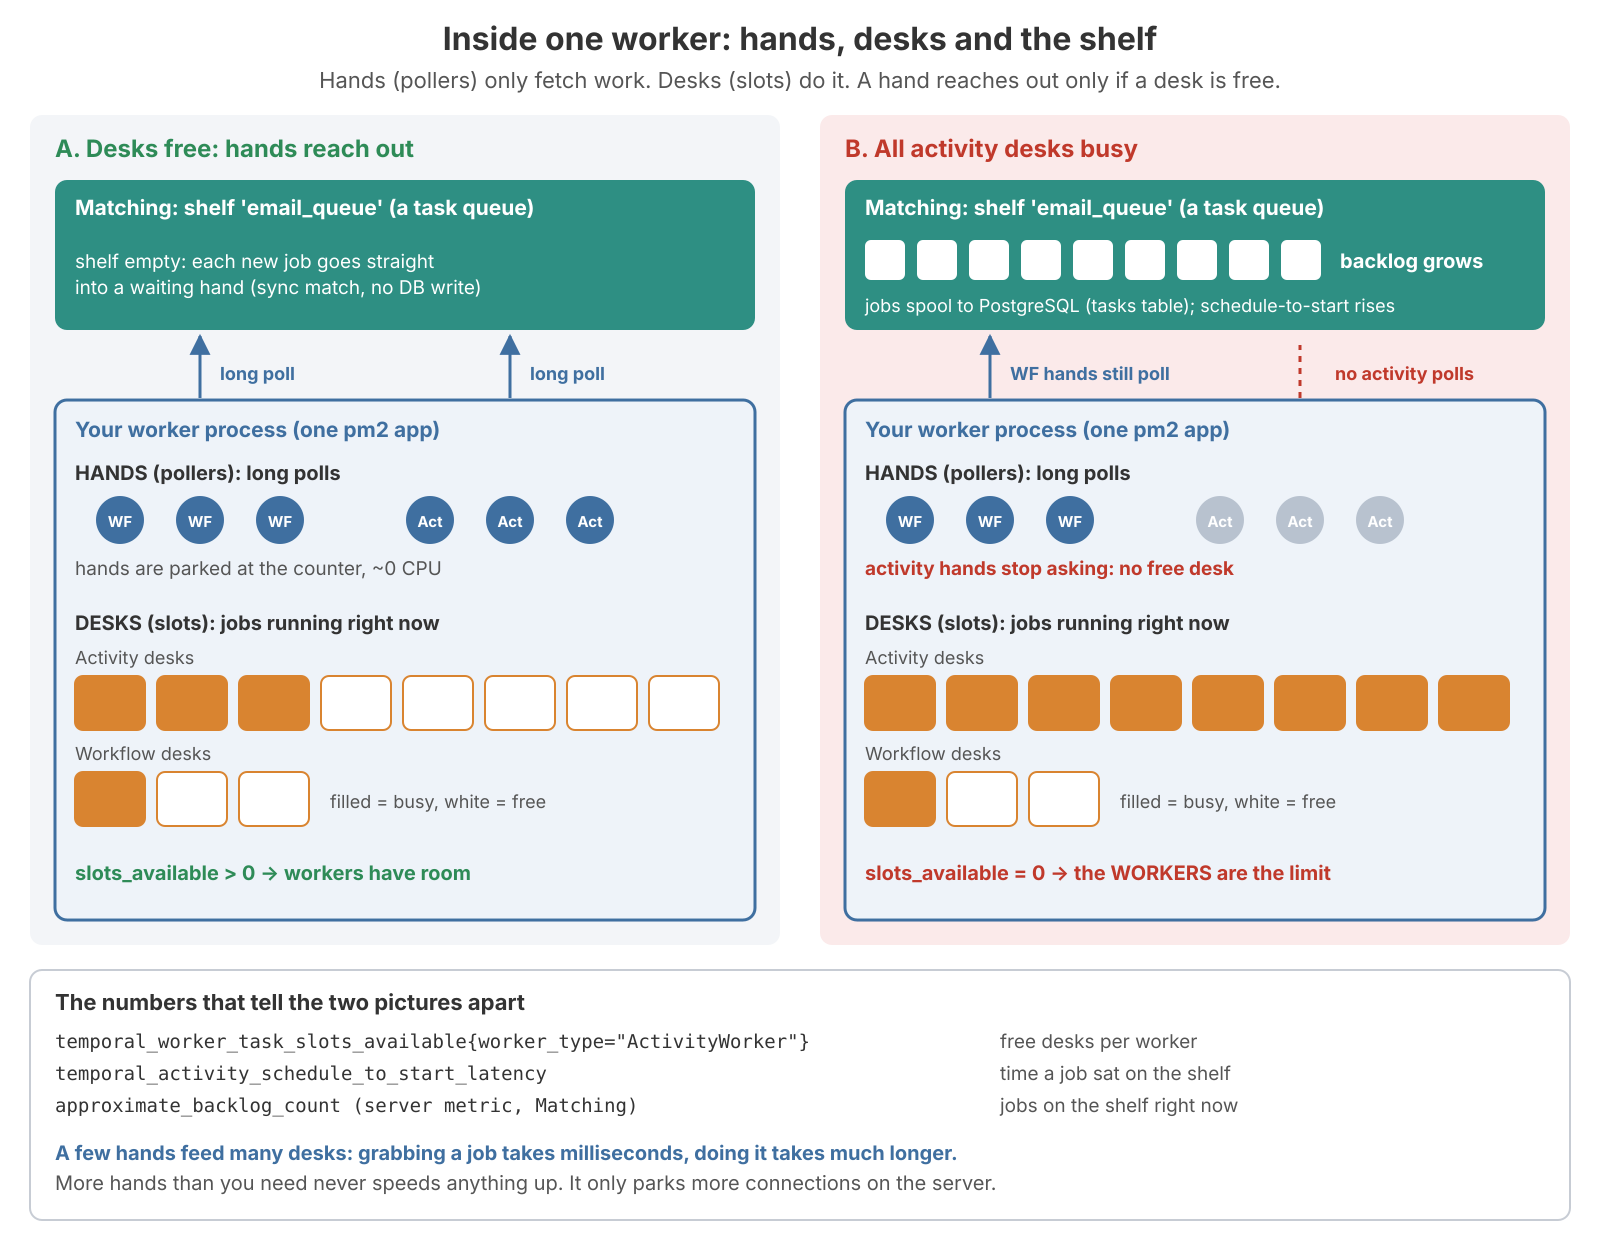
When a type's slots are full the worker stops polling for it. That's backpressure, and it's why an overloaded worker shows up first as schedule-to-start latency and a Matching backlog, not as errors in the worker.
Defaults per SDK, from Temporal's worker tuning reference (version-dependent):
| SDK | WF slots | Activity slots | WF pollers | Activity pollers | Cached workflows |
|---|---|---|---|---|---|
| Go | 1000 | 1000 | 2 | 2 | 10,000 |
| Java | 200 | 200 | 5 | 5 | 600 |
| TypeScript | 40 | 100 | 10 | 10 | dynamic (e.g. 2000 at 4 GiB) |
| Python | 100 | 100 | 5 | 5 | 1000 |
| .NET | 100 | 100 | 5 | 5 | 10,000 |
Pollers: few, and at least one per partition
Too few and slots sit free while tasks wait (and unpolled partitions spool). Too many and you park thousands of idle polls on Frontend and Matching. Count them before adding any:
waiting polls ≈ workers × task queues × pollers per queue
              = 200 × 3 × 10 = 6,000    (12,000 with 10 workflow AND 10 activity pollers each)
That's against a 1200 limit per Frontend host, per API, per namespace. How many do you need? Little's law, illustrative: busy pollers ≈ tasks/s × time to grab one. At 500 tasks/s and ~20 ms per grab that's about 10 pollers across the whole fleet, plus at least one per read partition per queue and type, plus margin.
Temporal's docs now recommend poller autoscaling for most cases, since hand-set counts end up too high or too low. In Go it's WorkflowTaskPollerBehavior / ActivityTaskPollerBehavior set to worker.NewPollerBehaviorAutoscaling(...) (Go SDK v1.36.0+), which overrides MaxConcurrent*TaskPollers; other SDKs have equivalents in recent releases.
Slots: size them with Little's law
Slots are either fixed-size (maxConcurrentActivityTaskExecutions in TypeScript, MaxConcurrentActivityExecutionSize in Go) or handed out by a resource-based tuner that targets CPU and memory (the docs warn the targets can still be exceeded; tuners replace the fixed options, and setting both fails at startup).
// Illustrative TypeScript worker. Values are a starting point, not a recommendation.
const worker = await Worker.create({
  connection,
  namespace: 'default',
  taskQueue: 'email_queue',
  workflowsPath: require.resolve('./workflows'),
  activities,
  maxConcurrentActivityTaskExecutions: 100, // activity slots
  maxConcurrentWorkflowTaskExecutions: 40,  // workflow slots (decisions are quick)
  maxConcurrentActivityTaskPolls: 5,
  maxConcurrentWorkflowTaskPolls: 5,
  maxCachedWorkflows: 2000,                 // memory vs replay
  stickyQueueScheduleToStartTimeout: '10s',
  shutdownGraceTime: '30s',                 // pm2 kill_timeout must exceed this
});
await worker.run(); // handles SIGINT/SIGTERM
Activity slots are also a concurrency limit on whatever the activity calls: 1000 slots on 10 workers is up to 10,000 concurrent calls into your email API or app database. Size slots to the downstream, not just the worker.
Sizing is concurrency = rate × duration. Illustrative: 300 workflows/s with 3 activities each is ~1200 workflow tasks/s (start plus three completions) and 900 activity tasks/s.
workflow slots busy = 1200/s × 0.015 s ≈ 18
activity slots busy =  900/s × 0.250 s ≈ 225
× 2 burst headroom  → ~40 WF slots, ~450 activity slots across the fleet
450 ÷ 100 per worker → 5 workers, + 1 for N+1 = 6
Then measure. Capacity planning applies the same law across the whole chain. On the worker, memory is dominated by the sticky cache (too big → OOM → replay storm elsewhere) and CPU by replay and your activity code; pollers cost almost nothing locally — their cost is on the server.
Is the wait on the shelf or at the desk?
Schedule-to-start (temporal_activity_schedule_to_start_latency, temporal_workflow_task_schedule_to_start_latency) runs from History scheduling a task to a worker starting it, so every hop adds to it. Alone it only says "something in between is slow". The slot gauge, temporal_worker_task_slots_available, says which side of the counter is short.
| Observation | Diagnosis | Action | Do NOT |
|---|---|---|---|
| S2S up, 0 pollers on the queue | nobody at this queue | workers down, or a typo'd queue name / wrong namespace | scale the server |
| S2S up, slots ≈ 0, worker CPU high | worker fleet saturated | add workers | add Matching hosts or partitions |
| S2S up, slots ≈ 0, worker CPU low | slots too small for IO-bound work | more slots or a tuner; check downstream | — |
| S2S up, slots free, few pollers, poll errors | poller starvation | more pollers / autoscaling; check LB timeout, namespaceCount | — |
| S2S up, slots free, History transfer-queue lag | History late to enqueue | History, shards, PostgreSQL | blame Matching |
| S2S up, slots free, one queue's backlog up, its owners hot | partitions | raise that queue's partitions, then hosts | raise them globally |
| S2S up, slots free, task persistence latency up | PostgreSQL | DB first | add partitions |
| Workflow-task S2S jumps to 5–10 s after a deploy | sticky cascade | graceful shutdown, rolling off-peak deploys | scale the server |
| S2S low, activity still slow | your activity | your code | touch Temporal |
Check in that order: worker side first, then History, then Matching, then PostgreSQL. The one rule: never add Matching hosts because schedule-to-start is high while slots available = 0.
# Schedule-to-start p95 per queue (the _seconds suffix depends on your exporter)
histogram_quantile(0.95, sum by (le, task_queue) (rate(temporal_activity_schedule_to_start_latency_seconds_bucket[5m])))

# Free activity slots, fleet-wide (0 = the workers are the limit)
sum by (task_queue) (temporal_worker_task_slots_available{worker_type="ActivityWorker"})

# Server-side backlog per queue, and one hot Matching owner
max by (namespace, taskqueue, task_type) (approximate_backlog_count)
sum by (instance) (rate(process_cpu_seconds_total{job="temporal-matching"}[5m]))

# Too many pollers? Frontend rejections by cause
sum by (resource_exhausted_cause) (rate(service_errors_resource_exhausted[5m]))# Pollers and backlog for one queue; the workflow side is a separate queue
temporal task-queue describe --namespace default --task-queue email_queue --task-queue-type activityTemporal publishes no universal schedule-to-start threshold; derive it from your SLO (an activity that must start within 1 s 99% of the time → alert on p99 above 1 s for 10 minutes). For batch queues a backlog is normal, so alert on approximate_backlog_age_seconds instead. Grep /metrics for the real names before building dashboards.
Autoscaling workers: not on CPU
An activity calling a slow payment API spends 99% of its time waiting: all 100 slots taken, 5% CPU, and a CPU-based autoscaler that never adds a worker while schedule-to-start grows without bound. Temporal's docs give the pairing — high schedule-to-start with high worker CPU/memory means add workers; with low CPU/memory, add pollers or slots — and the slot gauge adds the third case: slots free and pollers fine means the server side.
So scale on schedule-to-start + free slots + backlog together. Under pm2 that's pm2 scale <app> <n> by hand or script. On Kubernetes, KEDA (v2.17+) has a temporal scaler that reads task-queue backlog from Frontend (its docs warn backlog-based activation is unreliable for scale-to-zero), or an HPA on adapter-defined metrics built from temporal_worker_task_slots_used / _available.
Scale-in is where the incidents are:
terminationGracePeriodSecondsor pm2kill_timeoutmust exceedWorkerStopTimeout/shutdownGraceTime, plus margin.- Long activities must heartbeat, or one killed mid-flight waits a full start-to-close before retrying.
- Every removed worker drops its sticky cache, so aggressive scale-in shows up as CPU spikes on the survivors and read load on History. Use long scale-down stabilisation windows (10 minutes is a reasonable start) and a non-zero minimum for latency-sensitive queues.
And more pollers is not more capacity. If every slot is busy, doubling maxConcurrentActivityTaskPolls does literally nothing — the extra pollers never poll. Scale workers for slots; keep pollers small or autoscaled.
What I'd tell myself before go-live
- History never calls a worker. Sync match costs PostgreSQL nothing; a backlog costs INSERT + SELECT + DELETE + dead tuples. Watch the sync-match ratio.
- The partition is the unit of parallelism. One partition, one owner. Raise partitions only on the hot queue — read first when growing, write first when shrinking — and keep pollers across the fleet ≥ read partitions.
- Is the wait on the shelf or at the desk? Slots at 0 means your workers, never Matching.
- A SIGKILLed warm worker costs a 5–10 s stall plus replays everywhere else. pm2
kill_timeoutlonger than your shutdown grace; deploy off-peak, one at a time. UpdateTaskQueue/s ≈ active partitions ÷matching.updateAckInterval. Leave it at 1 minute, and do the arithmetic before listing suspects.- Pollers fetch, slots work. Size slots with Little's law and the downstream's capacity; never autoscale on CPU alone.
- Two kinds of worker. The internal worker runs
temporal-sys-*housekeeping, needs its own credentials when Frontend has auth, doesn't do retention deletes, and should have two replicas.
Next in the series: timeouts, retries and determinism — the start-to-close timer that quietly recovers every lost handout above, and the replay rules that make sticky caches possible.