Temporal History Shards: The Ring, the range_id Stamp, Picking numHistoryShards and shardIOConcurrency
On this page
- The problem shards solve: two writers, one event #11
- The formula
- What a shard is, physically
- Who should own a shard: the membership ring
- Who can write: the range_id stamp
- The one thing the stamp can't survive
- Moving shards: hosts joining and dying
- When a host joins
- When a host dies
- Why the shard count can never change
- Too few shards vs too many: picking the number
- Too few: one-at-a-time funnels
- Too many: the idle tax
- 512 vs 4096: two cluster designs
- Measuring instead of guessing
- If you outgrow it anyway
- The second dial: shardIOConcurrency and the two locks
- What the semaphore actually gates
- Scope: every number is a cap, not a rate
- Little's law, and the 46 ms → 1.4 s cluster
- 1 → 2 → 4 → 8: when more slots help and when they hurt
- The workflow lock comes first
- When to add a slot, and how
- The two dials side by side
- Reading the failure modes
- What I'd tell myself before go-live
TL;DR: Event sourcing needs exactly one writer per workflow, so Temporal hashes every workflow into one of a fixed number of history shards:
farm.Fingerprint32(namespaceID + "_" + workflowID) % numHistoryShards + 1. A gossip ring (ringpop, consistent hashing) decides which History host should own each shard; a counter in PostgreSQL,shards.range_id, decides who can write — every write checks it underFOR SHAREin the same transaction, so a host that froze in a GC pause and woke up as a zombie getsShardOwnershipLostErrorand commits nothing. The shard count is a birth decision:shard_idis the first column of every primary key, the database remembers the number, and changing it means a new cluster. 512 vs 4096 is a choice of future (8× the ceiling for 8× the idle tax), not a choice of speed. Inside each shard,history.shardIOConcurrency(default 1) caps how many state-changing writes may be in flight at once, and Little's law —max writes/s ≈ shards × concurrency ÷ write latency— is why a cluster with 4 shards × 1 saw workflow starts go from 46 ms to 1.4 s while PostgreSQL was idle-fast.
The first Temporal cluster I really had to debug had a symptom that made no sense: starting a workflow, which normally took 46 ms, was taking 1.4 seconds at peak. PostgreSQL query times were fine. History CPU was fine. Nothing was erroring. The time was going somewhere between "History decided to write" and "PostgreSQL received the write" — and I didn't yet know there was a somewhere there.
The answer was a number set on day one and never looked at again: the cluster had been created with 4 history shards. This post is everything I had to learn to understand that sentence — what a shard actually is, how ownership is enforced, why the count can never change, and the second dial (shardIOConcurrency) that sits inside every shard.
The previous post covered what the History service does with one workflow — the event history, the mutable state row, the task queues it writes in the same transaction. This one is about how History splits millions of workflows across hosts without two of them ever writing the same one.
The problem shards solve: two writers, one event #11
Start with one History node and add a second. Now a signal and an activity completion for the same workflow arrive at the same moment:
- Node A reads the history, sees event #10, writes event #11 = "signal".
- Node B reads the history, sees event #10, writes event #11 = "activity done".
There are now two different event #11s, and the history is corrupt. The rule we need: for any given workflow, only one node may write at a time.
Inside one node, History already has two guards — a per-workflow lock and a conditional update on the executions row. What's missing is a guard across nodes. The options:
| Design | Problem |
|---|---|
| One global writer for the cluster | No parallelism; one host does all the work |
| One owner lease per workflow | Millions of leases to acquire, renew and fence. Every start is a lease write; failover re-leases millions of rows |
| Shards: a fixed number of leases, each covering many workflows | Thousands of leases, not millions. Parallel across shards, one writer per workflow, failover moves 1/N of the leases |
Temporal picks the third. A shard is simply a box of workflows with exactly one owner. The number of boxes is persistence.numHistoryShards, fixed for the life of the cluster. Adding History hosts redistributes the boxes; it never adds boxes.
The formula
From common/util.go, WorkflowIDToHistoryShard:
idBytes := []byte(namespaceID + "_" + workflowID)
hash := farm.Fingerprint32(idBytes)
return int32(hash%uint32(numberOfShards)) + 1 // ShardID starts with 1
Three details that matter more than they look:
- It's the namespace ID (a UUID), not the name, and shard IDs run
1..N— there is no shard 0. - The run ID is not in the key. Every run of one workflow ID — continue-as-new, retries, cron runs, resets — lands in the same shard. That's what makes "is a workflow with this ID already running?" a single-shard check against
current_executions. It's also why one hot workflow ID can never be spread out. - Namespaces don't get their own shards. Every namespace is spread across all of them. Isolation between namespaces comes from Frontend rate limits, not partitioning.
Anyone can compute it — Frontend, History and Matching all do it locally, and so can you:
tdbg history-host get-shardid --namespace-id <uuid> --workflow-id order-1001What a shard is, physically
On the owning host, shard 7 is a shard context: the shards row's range_id (proof of ownership) and persisted queue ack levels, a task-ID allocator handing out IDs in blocks of 2^20 starting at range_id << 20, an IO semaphore sized by history.shardIOConcurrency, queue readers for its transfer, timer and visibility task rows, a per-shard events cache (unless the host-level one is on), and the engine that executes its API calls.
In PostgreSQL, shard 7 is one row in shards plus every row in every other table with shard_id = 7. That's the key insight for everything below: moving a shard copies no data. It moves the right to write rows with that shard_id, and caches start cold on the new owner.
One thing that confused me early: range_id grows during normal work, not just on ownership changes. In source, RangeSizeBits is 20 and nextTaskID = rangeID << rangeSizeBits, so a busy shard bumps range_id every time it burns through 2^20 task IDs. A big range_id on a cluster that never changed hosts is not churn.
Who should own a shard: the membership ring
Every History host joins a gossip-based membership list (ringpop). Each host is placed on a consistent-hash ring at 100 virtual points (system.ringpopReplicaPoints); shard S belongs to the first host point after hash("S"). Every node computes the same answer, so Frontend knows where to route.
Three consequences of consistent hashing that show up in production:
- Ownership is scattered, not ranged. Shard 1 may be on host 3, shard 4 on host 4, shard 5 on host 1.
- The split is uneven by design. With 4096 shards on 4 hosts, one simulation gave 1056 / 946 / 1048 / 1046 — about ±7%. That's normal. I only start investigating if max ÷ min goes above ~1.3, and even then load per host matters more than shard count per host.
- Adding a host only moves shards to the new host. In the same simulation, adding a 5th host moved exactly the ~820 shards it now owned, roughly 205 from each old host; zero moved between hosts 1–4.
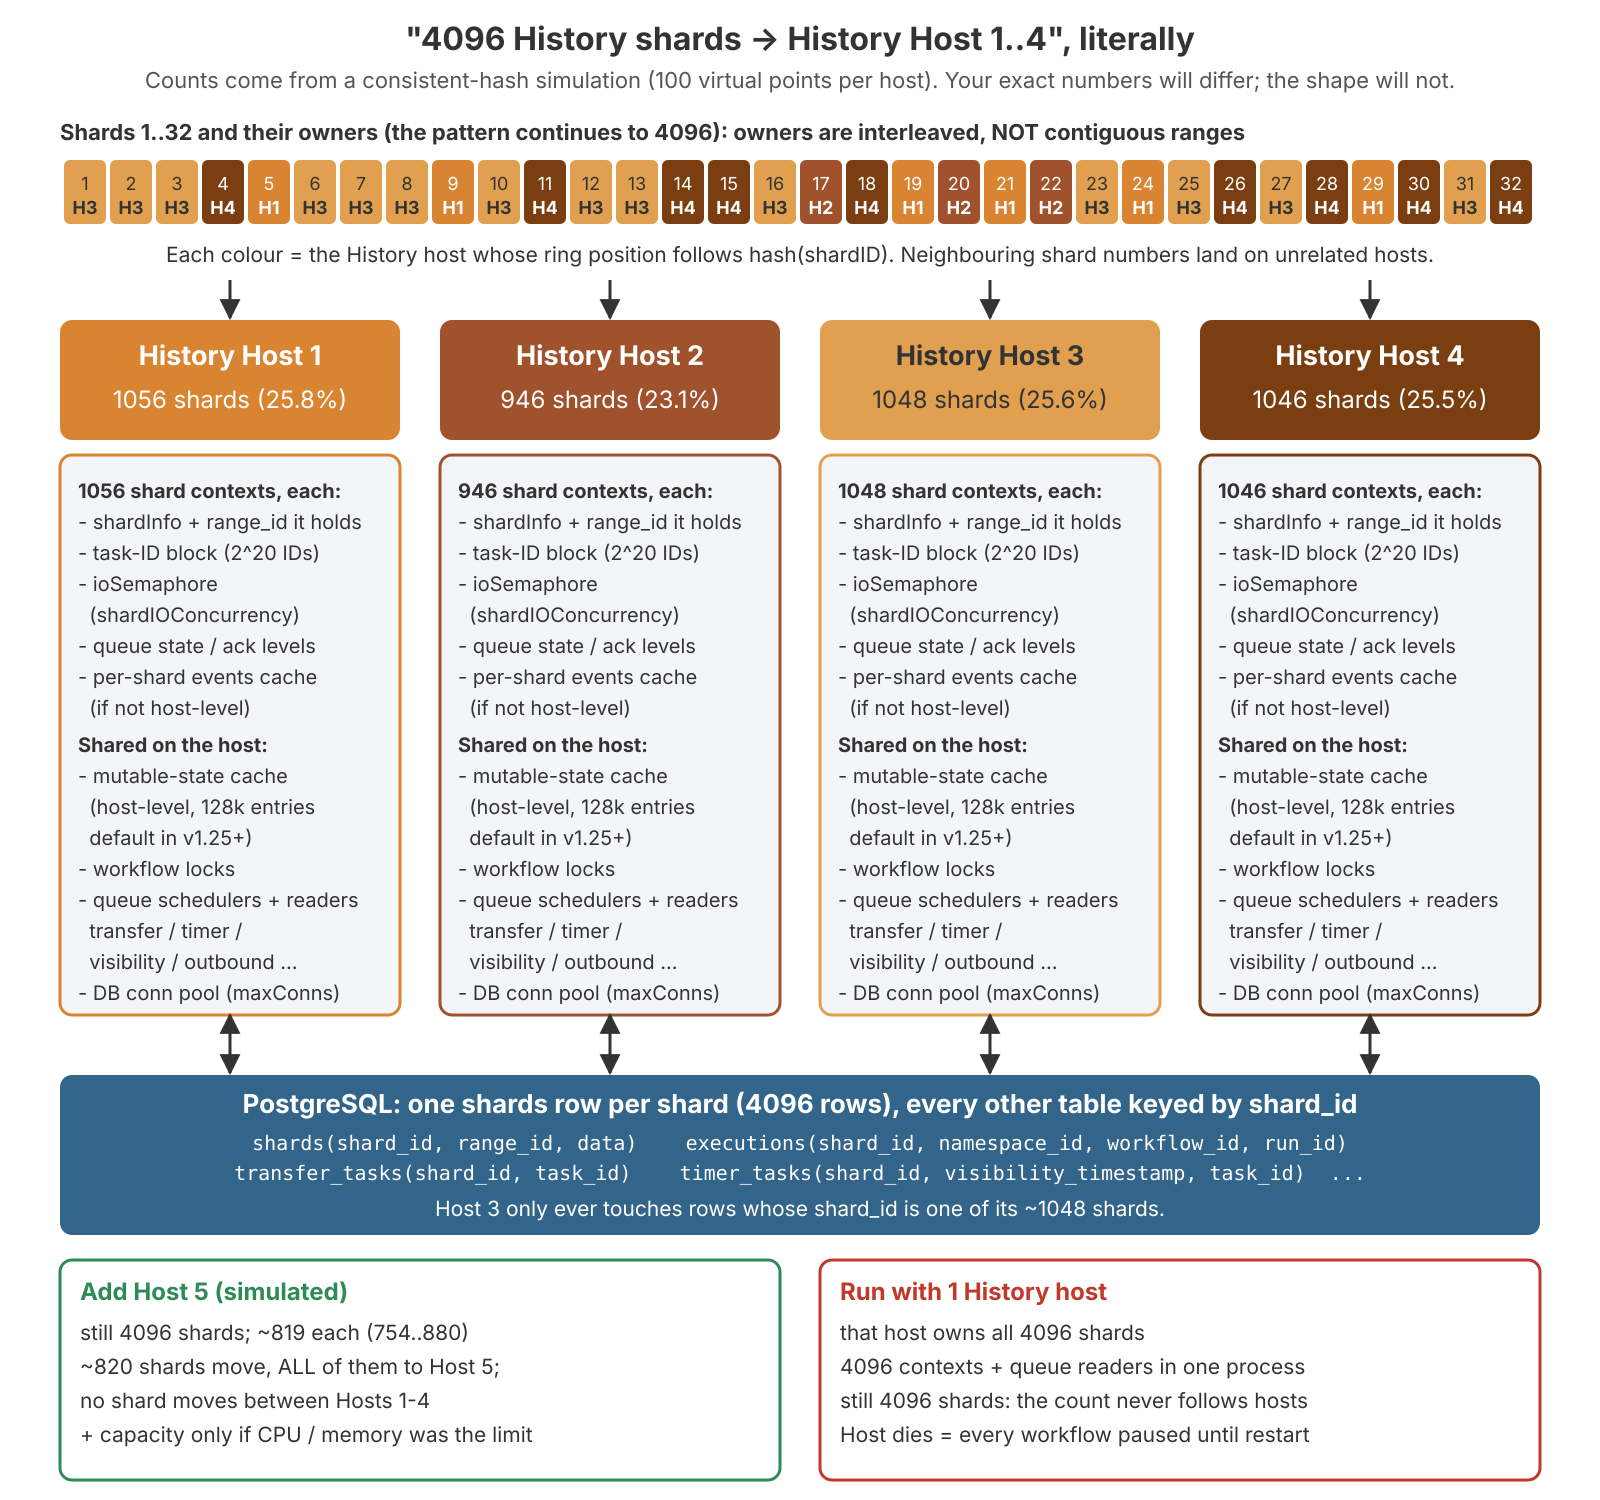
Temporal's docs give a starting ratio of one History process per 500 shards. Treat that as a starting point, not a limit — for 4096 shards it suggests ~8 processes, and plenty of clusters run fewer, bigger processes after load testing. The real per-host limit is what your CPU, memory, GC and persistence latency measurements say.
Who can write: the range_id stamp
The ring alone isn't enough. Here's why.
Host A freezes — a 20-second GC pause, a NIC flap, a frozen VM. Gossip marks it dead and gives shard 7 to host B. Then A wakes up, still believing it owns shard 7, and tries to commit a write it had in flight. Two writers again. A node that's dead to everyone else but still acting is a zombie, and gossip can't stop it, because gossip is just every node's opinion.
The fix is a counter that only ever goes up — shards.range_id — checked in the same database transaction as the data. From the PostgreSQL plugin (sqlplugin/postgresql/shard.go, v1.32):
-- taking ownership / renewing the range (UpdateShard)
BEGIN;
SELECT range_id FROM shards WHERE shard_id = $1 FOR UPDATE;   -- must equal PreviousRangeID
UPDATE shards SET range_id = $1, data = $2, data_encoding = $3 WHERE shard_id = $4;
COMMIT;

-- every workflow write for that shard (same tx as executions/tasks writes)
BEGIN;
SELECT range_id FROM shards WHERE shard_id = $1 FOR SHARE;    -- must equal the writer's range_id
-- ... UPDATE executions ..., INSERT INTO transfer_tasks ..., etc.
COMMIT;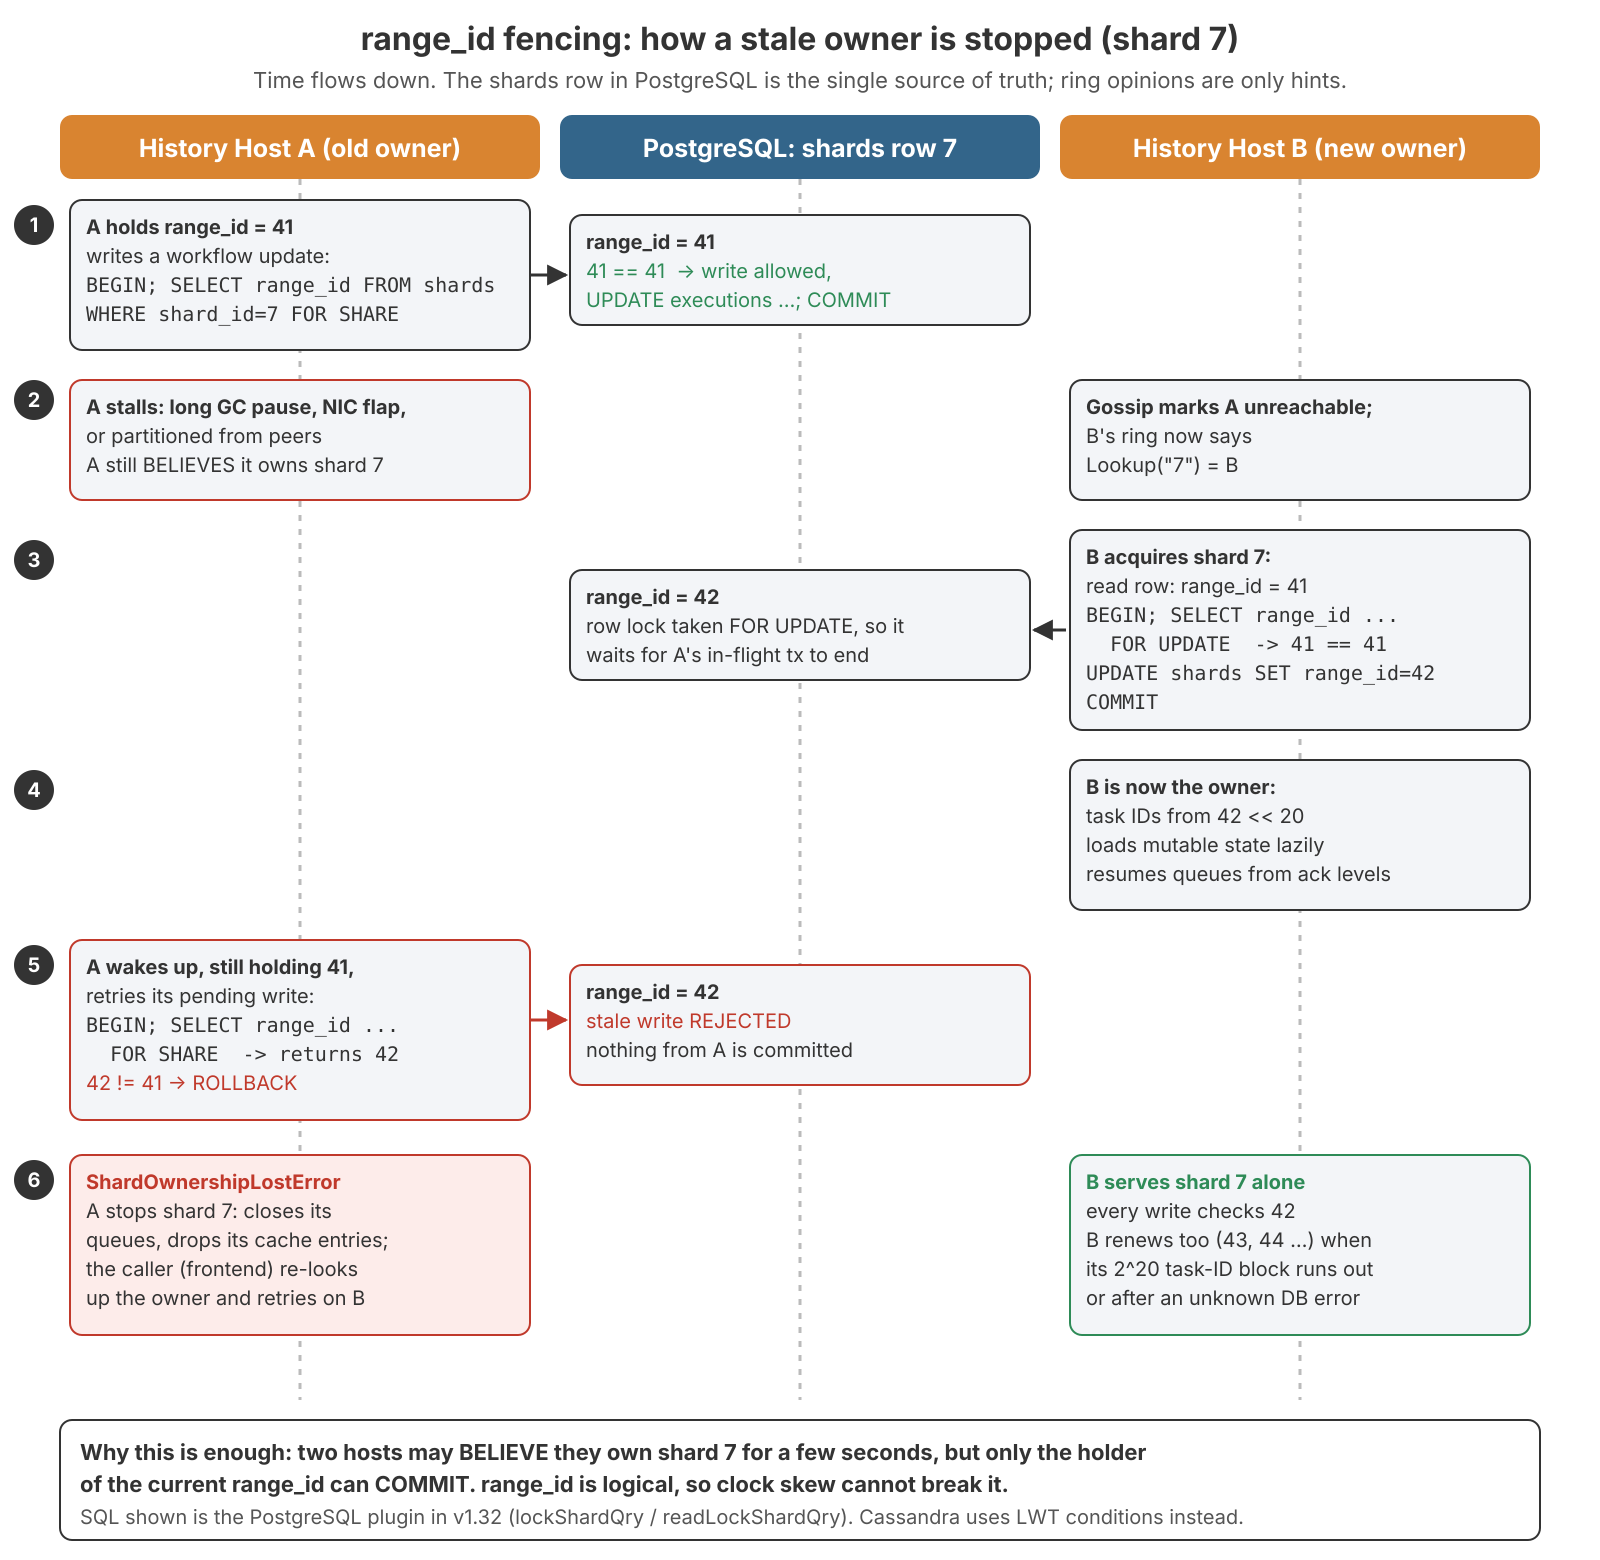
Step by step:
- Host A owns shard 7 with
range_id = 41. Each write takesFOR SHAREon row 7, sees 41, commits. Many writers can holdFOR SHAREat once — that's what makesshardIOConcurrency > 1possible. - A stalls. Gossip marks it unreachable; B's ring now says shard 7 is B's.
- B runs
SELECT ... FOR UPDATE. That waits for any of A's in-flightFOR SHAREtransactions, so a write A already had going either commits before the takeover or not at all. B setsrange_id = 42. - B is the owner. New task IDs come from
42 << 20. Queues resume from the persisted ack levels. - A wakes and retries its write.
FOR SHAREreturns 42, not 41. The plugin returnsShardOwnershipLostError— "Failed to lock shard. Previous range ID: 41; new range ID: 42" — and rolls back. Nothing from A commits. - A's shard context stops shard 7: closes its queues, drops its cache entries. The caller re-resolves the owner and retries on B.
What if a write's outcome is unknown — a timeout or connection reset in the middle of COMMIT? The shard context re-acquires its own shard (range_id + 1) before continuing. After that, a late arrival of the old write is impossible, and a read shows for certain whether it landed.
So the honest answer to "can two hosts own the same shard?":
| Possible? | Why | |
|---|---|---|
| Two hosts believe they own shard S | Yes, for seconds | Ring views converge via gossip, not instantly |
| Two hosts commit writes to shard S | No | Writes check range_id under FOR SHARE; acquisition changes it under FOR UPDATE |
| Two hosts carry out side effects (e.g. both push the same activity task) | Briefly | Task execution is at-least-once and de-duplicated by state checks; activities should be idempotent anyway |
Because range_id is a logical counter, not a timestamp, clock skew can't break it. Temporal chooses consistency over availability for the affected shard for a few seconds; some requests fail and get retried.
The one thing the stamp can't survive
Fencing assumes the shards row is durable and only moves forward. If your PostgreSQL primary fails over to an asynchronous replica that missed the last commits, range_id — and acknowledged workflow writes — can effectively go backwards, and Temporal cannot detect it. For the Temporal database, use synchronous replication (or a managed PostgreSQL with zero-RPO failover), and plan to restart History after a promotion so every shard is re-acquired with a fresh stamp. Failover drills get their own post later in the series.
Moving shards: hosts joining and dying
Taking a shard, from controller_impl.go and context_impl.go:
- The shard controller re-checks all shards on every membership change and every
history.acquireShardInterval(1 min),history.acquireShardConcurrency(10) at a time. - Acquisition reads the
shardsrow and bumpsrange_id, retrying with backoff for up to 5 minutes (each attempt bounded byhistory.shardIOTimeout, 5 s) — enough to ride out short database blips. - Queue processors start from the persisted ack level, not where the previous owner actually got to. Tasks in between run again. Task execution re-checks state, so this is safe: at-least-once.
- Mutable state is not preloaded. The new owner loads each workflow from PostgreSQL the first time it's touched. Cold cache.
When a host joins
The new host upserts itself in cluster_membership, joins gossip, and within seconds every member's ring view updates. The old hosts close the shards that now map to the newcomer; it acquires them. For a few seconds, requests for moving shards fail with ShardOwnershipLost or wait, and are retried — about 1/N of workflows see a latency bump. Then a few minutes of elevated PostgreSQL reads and p99 while the new host's cache warms.
The trap here is adding several hosts at once, or a crash-restart loop: shards move repeatedly, caches never warm, range_id churns and ownership-lost errors climb. Add one host at a time and wait for shard_closed_count and sharditem_acquisition_latency to settle.
When a host dies
In-flight calls fail; anything committed is safe, anything not committed never happened and is retried. Ringpop's SWIM-style probes mark the host suspect, then faulty (a clean shutdown is faster — the host announces it's leaving). The survivors acquire its shards, which also fences it if it was only frozen, and resume its queues from the persisted ack level, so timers that came due during the gap fire late, not never. Then cold caches push up PostgreSQL reads and History p99.
Temporal doesn't publish a recovery number. Expect seconds to tens of seconds of stalls for the dead host's ~1/N of workflows, then elevated p99 — but the only number worth having is the one you measure by killing a History process in staging under load.
After a History host dies, I check:
numshards_gaugeacross survivors sums tonumHistoryShards.sharditem_created_counton survivors rose by roughly the dead host's shard count, then went flat.service_errors_shard_ownership_lostspiked and returned to ~0.- Survivors' CPU and memory now that each holds 4096 ÷ 3 shards. N-1 capacity is a design requirement, not a nice-to-have.
task_latency_queueback to baseline.
Why the shard count can never change
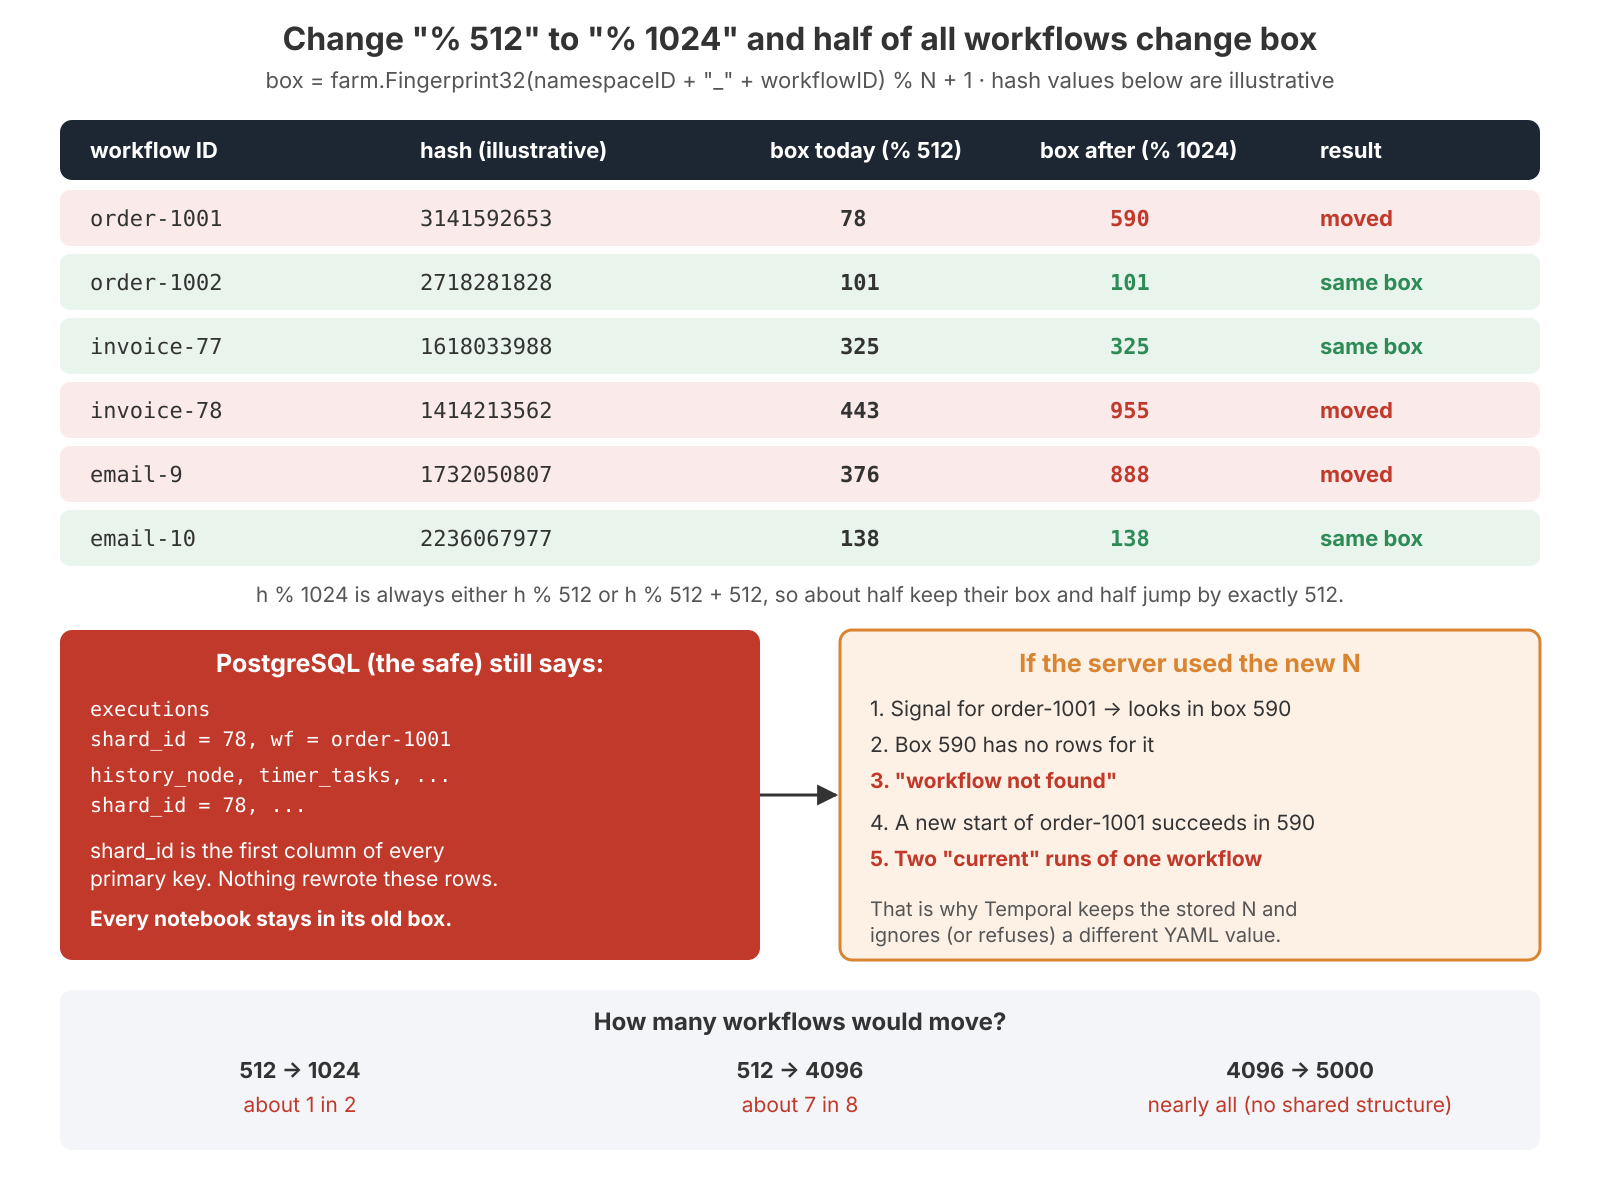
Look at the formula again: hash % N. Change N and the answer changes for most workflows — and every row in PostgreSQL is still stored under the old shard_id.
| Change | Existing workflows that would move |
|---|---|
| 512 → 1024 | about half (h % 1024 is either h % 512 or that + 512) |
| 4096 → 8192 | about half |
| 512 → 4096 | about 7 in 8 |
| 4096 → 5000 | nearly all — no shared structure |
If the server started with a new N, a signal for order-1001 would look in shard 590 when its rows sit in shard 78: "workflow not found". Worse, a new start of the same ID would succeed in the new shard, and you'd have two "current" runs of one workflow.
(Why not consistent hashing here too? It's already used — for shard → host. Workflow → shard is plain modulo on purpose: cheap, stateless, computable by every Frontend with no lookup.)
There are four independent reasons the number is frozen:
-
The modulo, above.
-
shard_idleads every primary key. From the PostgreSQL schema:executions PRIMARY KEY (shard_id, namespace_id, workflow_id, run_id) current_executions PRIMARY KEY (shard_id, namespace_id, workflow_id) history_node PRIMARY KEY (shard_id, tree_id, branch_id, node_id, txn_id) transfer_tasks PRIMARY KEY (shard_id, task_id) timer_tasks PRIMARY KEY (shard_id, visibility_timestamp, task_id) activity_info_maps PRIMARY KEY (shard_id, namespace_id, workflow_id, run_id, schedule_id)Resharding means rewriting every row of every workflow including its full event history, re-allocating task IDs from new
range_idblocks, and rebuilding the ack levels stored as a protobuf blob inshards.data— while workflows keep running. -
The database remembers N. At first start the server writes
HistoryShardCountintocluster_metadata_infoand compares your YAML to it on every boot. On v1.32 (temporal/fx.go) a mismatch is logged as a warning and the stored value wins — your config file silently lies. My own notes from an earlier setup record the server refusing to start on a mismatch instead; behaviour differs by version. Either way you never get more shards. -
There is no resharding tool. The docs say the count "cannot be changed" after the database is integrated.
# What the cluster actually has (stored value, not your YAML)
temporal operator cluster describe -o json | grep -i historyShardCount
Don't try to force it by editing cluster_metadata_info by hand. The server would then start with the new N and look up every existing workflow in the wrong shard — exactly the corruption the check exists to prevent. Treat numHistoryShards in config as a record of a decision already made, not a knob.
Too few shards vs too many: picking the number
Too few: one-at-a-time funnels
Each shard is a funnel: one owner host, one IO semaphore (history.shardIOConcurrency, default 1) shared by all its workflows, one task-ID allocator, and one queue reader per category (loading at most history.transferProcessorMaxPollRPS = 20 batches/s of history.transferTaskBatchSize = 100). Task execution is a host-level scheduler; loading and ack tracking are per shard.
Illustrative arithmetic: if a gated write takes 5 ms and there's one slot per shard, one shard tops out near 200 writes/s.
| Shards | Offered writes/s | Average per shard | Headroom vs 200/s |
|---|---|---|---|
| 16 | 4,000 | 250 | over the limit |
| 512 | 4,000 | ~7.8 | 25× |
| 4096 | 4,000 | ~1 | 200× |
And averages flatter you: hash skew is worse with few shards, one chatty workflow drags its shard-mates down with it, and a batch job starting 50,000 workflows in 10 seconds hits every shard at once. What it looks like from outside: semaphore_latency{operation="ShardInfo"} rising on one host while persistence_latency stays normal, and slowness for "some workflows, seemingly at random". Also, a hard host ceiling: with 64 shards, the 65th History host gets nothing to do.
Too many: the idle tax
Every shard costs something at zero traffic: each queue reader polls its slice of the task tables at least every max-poll-interval (1 min for transfer, visibility and outbound; 5 min for timers) even when nothing is new; ack levels are checkpointed to the shards row every history.shardUpdateMinInterval (5 min, sooner after 1000 tasks); plus goroutines, memory, and one more acquisition on every restart.
The idle arithmetic (illustrative, from those defaults):
Checkpoint UPDATEs:  N ÷ 300 s
    512   →  ~1.7 UPDATE shards/s
   4096   →  ~13.7 UPDATE shards/s      ← zero traffic
  65536   →  ~218 UPDATE shards/s

Idle polls (3 categories at 1/min + timer at 1/5 min ≈ 0.053/s per shard):
    512   →  ~27 range SELECTs/s
   4096   →  ~218 range SELECTs/s
  65536   →  ~3,500 range SELECTs/s
Each query is an index range scan returning zero rows. But they're real connections, real CPU and — for the UPDATEs — real WAL. On an idle cluster they sit at the top of pg_stat_statements by call count:
SELECT calls, round(mean_exec_time::numeric, 2) AS mean_ms, left(query, 80) AS query
FROM pg_stat_statements
ORDER BY calls DESC
LIMIT 10;
Memory is version-dependent. Up to v1.24 the mutable-state cache was per shard (history.cacheMaxSize, 512 entries each); from v1.25 one host-level cache (history.hostLevelCacheMaxSize, 128,000 entries) is the default, so it no longer scales with shards. The events cache, however, is still per shard by default through v1.32 (history.eventsCacheMaxSizeBytes, 512 KiB each, unless history.enableHostLevelEventsCache is on): ~512 MiB worst case per host at 1024 shards, ~2 GiB if one host held all 4096. That's the one that grows when you lose a host — on 4 hosts with 4096 shards, each survivor's ceiling goes from ~512 MiB to ~683 MiB at the exact moment it's doing a third more work.
512 vs 4096: two cluster designs
| Design question | 512 shards | 4096 shards |
|---|---|---|
| Designed for | small cluster, known bounded load | a cluster that may grow 10× without a rebuild |
| History processes at the docs' 1-per-500 ratio | ~1 | ~8 |
| Comfortable History host range (my read) | 1–4 | 3–30+ |
Cluster-wide IO slots at shardIOConcurrency = 1 | 512 | 4096 |
Idle checkpoint UPDATEs/s | ~1.7 | ~13.7 |
| Idle polls/s | ~27 | ~218 |
| Shards to acquire after a full restart | 512 | 4096 |
| If you outgrow it | new cluster + migration | new cluster + migration, much later |
4096 wins every ceiling row; 512 wins every idle-cost row; neither is faster at low load. You're choosing which future you're paying for, and you can't switch later.
Forum guidance from Temporal staff is commonly quoted as 512 for small production, 2048–4096 for "millions of executions per day", and "rare for even large production clusters to exceed 4096"; the docs say clusters have run anywhere from 1 to 128K. My rough map for self-hosted PostgreSQL: 4–16 only for dev and CI (never anything shared — that's the cluster from the intro), 128–512 for staging or small bounded production, 1024–2048 for mid-size production or a staging cluster you'll measure on, 4096 as the default for "real production, may grow", and 8192+ only with measured per-shard pressure. Beyond that you're usually on Cassandra or sharded persistence: one PostgreSQL primary has a single-writer ceiling (WAL, fsync, CPU) that you'll hit long before a well-chosen 4096 becomes the limit, and more shards just add idle load to the component that's already your wall.
Measuring instead of guessing
Not every load number is a shard question. If an operation writes workflow state (starts, activity schedule/complete, signals, timers firing, completions, deletes), it's a shard concern. If it only moves a task from a queue to a waiting worker (task queue volume, worker count, number of task queues), it's a Matching concern. Open-but-sleeping workflows barely matter — they're rows in PostgreSQL holding nothing.
The method I'd use: build staging like production but with 1024 shards — at the same total load each staging shard carries 4× a production shard's work, a built-in stress multiplier. Ramp with omes (or a replay of your workload) in steps — 25%, 50%, 100%, 150%, 200% of expected peak, 15–30 minutes each — and record:
sum(rate(state_transition_count_count[5m]))
histogram_quantile(0.99, sum by (le, instance) (rate(semaphore_latency_bucket{operation="ShardInfo"}[5m])))
histogram_quantile(0.99, sum by (le, operation) (rate(persistence_latency_bucket{operation=~"UpdateWorkflowExecution|CreateWorkflowExecution"}[5m])))
History metrics deliberately carry no shard_id label (cardinality), so find the busiest shard in PostgreSQL:
SELECT shard_id, count(*) FROM transfer_tasks GROUP BY 1 ORDER BY 2 DESC LIMIT 10;
SELECT shard_id, count(*) FROM timer_tasks
 WHERE visibility_timestamp < now() + interval '1 minute' GROUP BY 1 ORDER BY 2 DESC LIMIT 10;
(Newer schemas may use history_immediate_tasks / history_scheduled_tasks — run \dt first.) Then extrapolate. Illustrative numbers:
Staging, 1024 shards, step "200% of prod peak":
  total            = 6,000 state transitions/s
  avg per shard    ≈ 5.9 /s
  busiest/avg      ≈ 2.5
  slot wait p99 flat until ~12 /s per shard, then climbs while persistence p99 stays flat
                    → per-shard knee ≈ 12 /s at shardIOConcurrency = 1

Production, 4096 shards:
  expected peak    = 3,000 /s  → avg ≈ 0.73 /s per shard
  busiest          ≈ 0.73 × 2.5 ≈ 1.8 /s
  growth 5×        → 9 /s  <  12 /s knee  → 4096 is enough, with margin
If you land near the knee, first check whether PostgreSQL is the real limit; then try shardIOConcurrency 2–4; only after both does 8192 become a defensible number.
If you outgrow it anyway
There's no in-place path. The boring, reliable option is a new cluster with the new count, then draining namespace by namespace: point new starts for a namespace at the new cluster, have workers poll both, let in-flight workflows finish (or continue-as-new them across), retire the namespace on the old one. Multi-cluster replication can move running workflows, but it's documented as experimental, the two shard counts must be equal or integer multiples (4096 → 8192 works, 4096 → 6000 fails with "not multiples"), and global-namespace settings must have been set when the clusters were created. Migration gets a full runbook later in the series.
The second dial: shardIOConcurrency and the two locks
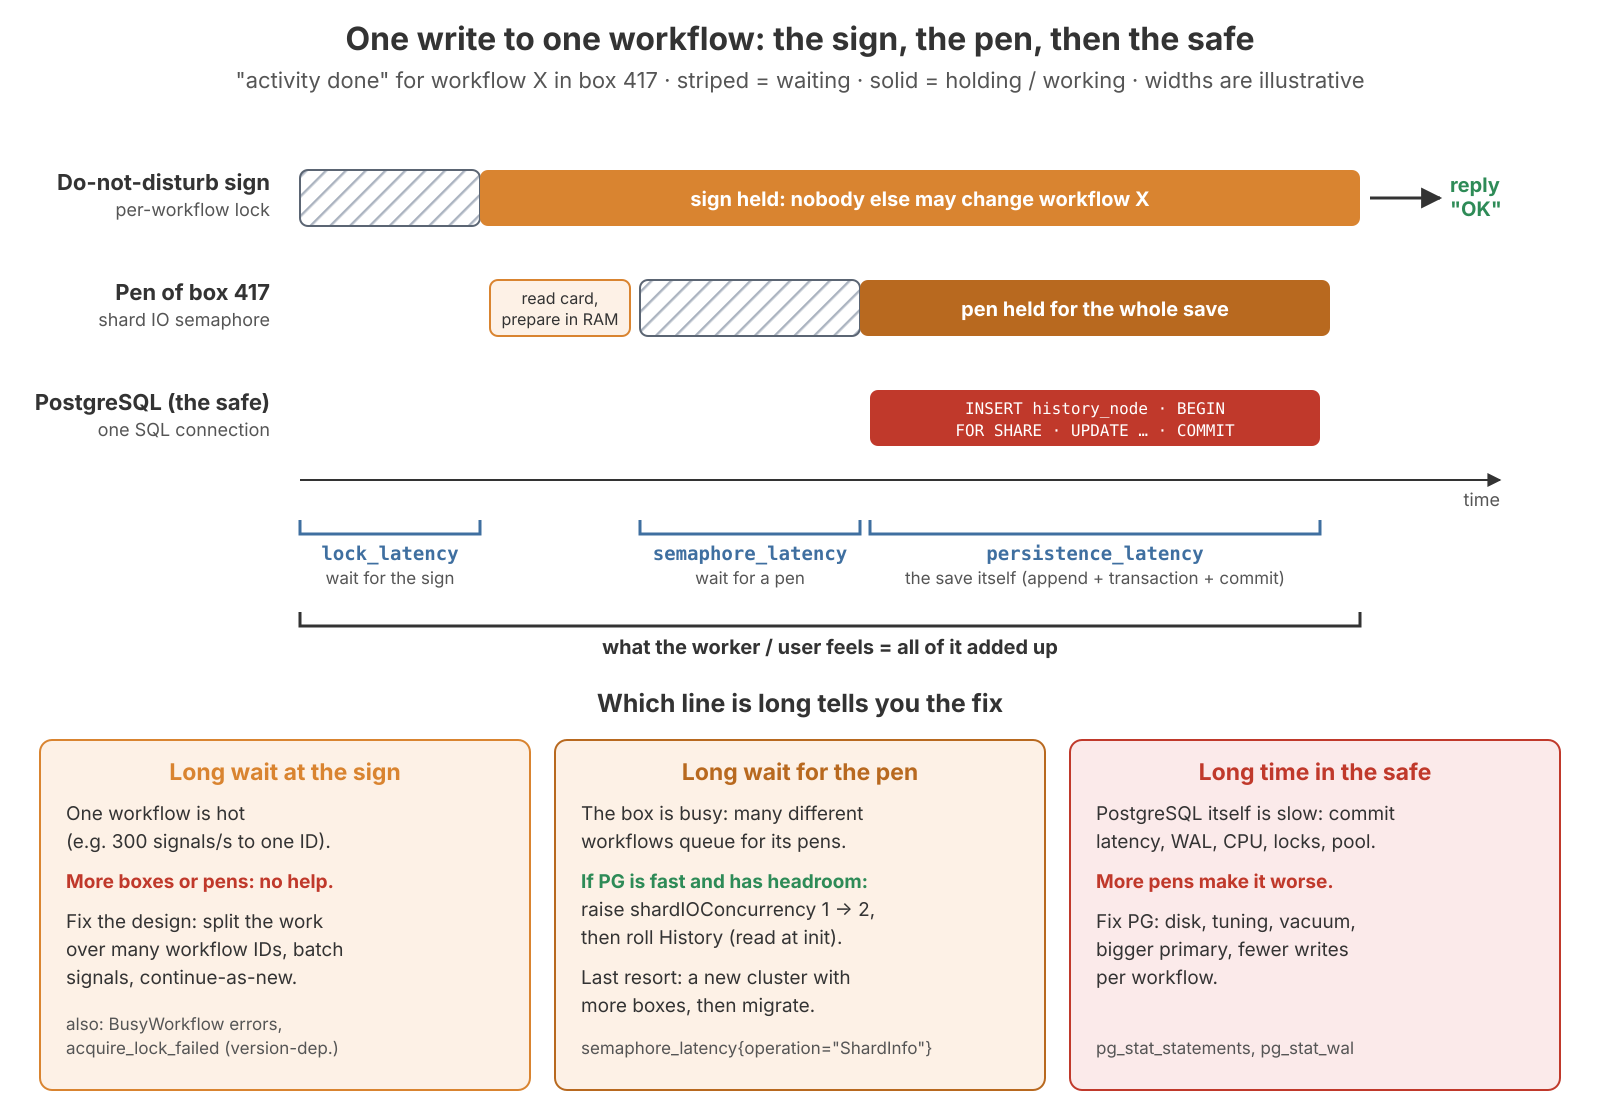
Back to the 46 ms → 1.4 s cluster. To find where a write waits, you need to know every place it can wait inside History. There are exactly two locks on the path, and each has its own metric.
- The per-workflow lock. One per workflow; a signal and an activity completion for the same workflow take turns. It protects one workflow's history from two writers.
- The shard IO semaphore.
history.shardIOConcurrencyslots per shard (default 1). Only that many state-changing database writes may be in flight at once for the whole shard, across every workflow in it. It limits how hard each shard can hit the database and keeps its writes ordered and fenced.
| Waiting for | Metric (names version-dependent) | High means |
|---|---|---|
| the workflow lock | lock_latency; also cache_latency, acquire_lock_failed, service_errors_resource_exhausted{resource_exhausted_cause="BusyWorkflow"} | one workflow is hot |
| a shard IO slot | semaphore_latency{operation="ShardInfo"} | the shard is busy; too few slots for the load |
| the save itself | persistence_latency{operation="UpdateWorkflowExecution"} | PostgreSQL is slow |
If users are slow but the database and the workflow lock both look fast, look at the line in between.
What the semaphore actually gates
The source comment in context_impl.go is explicit: "Despite its name, this semaphore is only applied to persistence requests that could cause potentially contention/conflict with each other."
Gated: CreateWorkflowExecution, UpdateWorkflowExecution (the hot path — every workflow task completion, activity start/complete, signal and timer fire), ConflictResolveWorkflowExecution, SetWorkflowExecution, DeleteWorkflowExecution, AddTasks, AssertOwnership, and UpdateShard (the ack-level checkpoint). Not gated: mutable-state loads on a cache miss, history reads and replay, queue readers loading tasks, range-deletes of finished tasks, and anything Matching or visibility does.
One gated UpdateWorkflowExecution in PostgreSQL (common/persistence/sql/execution.go):
1. INSERT INTO history_node ...            -- new events appended first
2. BEGIN
3.   SELECT range_id FROM shards WHERE shard_id = $1 FOR SHARE     -- the stamp check
4.   UPDATE executions ... ; UPSERT/DELETE *_info_maps ... ; INSERT transfer/timer/visibility tasks
5. COMMIT                                   -- WAL flush
The slot is held from before step 1 until step 5 returns. The shard's in-memory lock is taken only briefly before the DB call (to allocate task IDs and stamp range_id), which is why more than one slot genuinely overlaps database work.
The semaphore is created once per shard context (locks.NewPrioritySemaphore(ioConcurrency)) (API callers get high priority, background work like the checkpoint low) and its size is read once, when the shard context is created. Hold that thought.
Scope: every number is a cap, not a rate
| Level | Max in-flight gated writes | 4096 shards, 4 hosts, concurrency 4 |
|---|---|---|
| One shard | concurrency | 4 |
| One History host | shards_on_host × concurrency | ~4096 |
| Whole cluster | numHistoryShards × concurrency | 16,384 |
And other caps usually bind first:
actual in-flight on a host  ≤  min( shards_on_host × shardIOConcurrency,
                                     SQL pool maxConns for the default store,
                                     history.persistenceMaxQPS × latency,
                                     what the offered load actually generates )
The one most people miss: the docker config template defaults maxConns to 20 (SQL_MAX_CONNS). A host owning 1024 shards already has 1024 slots at concurrency 1 but only 20 database connections. On that host the connection pool is the host-wide limit; extra writes wait for a connection inside Go's database/sql while still holding their slot, and none of that latency is PostgreSQL work. Raising concurrency from 1 to 4 changes nothing if all 20 connections are busy. Check persistence_sql_in_use against persistence_sql_max_open_conn first.
That also kills a common claim: "4096 shards × 4 = we support 16,384 workflows." The product caps in-flight writes, not workflows — an open workflow waiting on a timer or signal is just rows in PostgreSQL holding no slot, no goroutine, no connection, and the docs describe each shard as responsible for tens of thousands of executions. It isn't a rate either (16,384 ÷ 5 ms would be 3.3M writes/s), and pools, history.persistenceMaxQPS (default 9000 per host), PostgreSQL's commit capacity and the per-workflow lock all bind long before it. It's only useful as a worst case when sizing max_connections. The real capacity question is "how many state transitions per second can the whole chain sustain at my latency SLO?" — and that's a benchmark.
Little's law, and the 46 ms → 1.4 s cluster
L = λ × W, so throughput λ = in-flight ÷ latency. For the cluster:
max writes/s ≈ shards × shardIOConcurrency ÷ time each write holds the slotIt's an upper bound, not a promise. Now the two clusters I've lived with:
| Cluster | Shards × slots | Time per write | Ceiling | What happened |
|---|---|---|---|---|
| The small one | 4 × 1 | ~10 ms | 4 ÷ 0.010 ≈ 400/s | Peak demand ~350/s. Slots ~88% busy by arithmetic, recorded closer to ~97% at peak. Starts went from 46 ms to 1.4 s. PostgreSQL was fast |
| A later cluster | 512 × 4 | ~13 ms | 2048 ÷ 0.013 ≈ 157,000/s | Shard slots stopped being the limit entirely |
Why does ~90% busy produce a 30× slowdown? Because queues aren't linear. In a simple single-server queue (illustrative), at 50% busy you wait about one service time, at 90% about nine, at 97% about thirty. That's the knee. Four shards meant four funnels, all of them near 100%, in front of a database that was barely working.
1 → 2 → 4 → 8: when more slots help and when they hurt
For one shard, max writes/s ≈ concurrency ÷ write latency(concurrency) — and the latency depends on concurrency, because every shard on every host pushes into the same PostgreSQL.
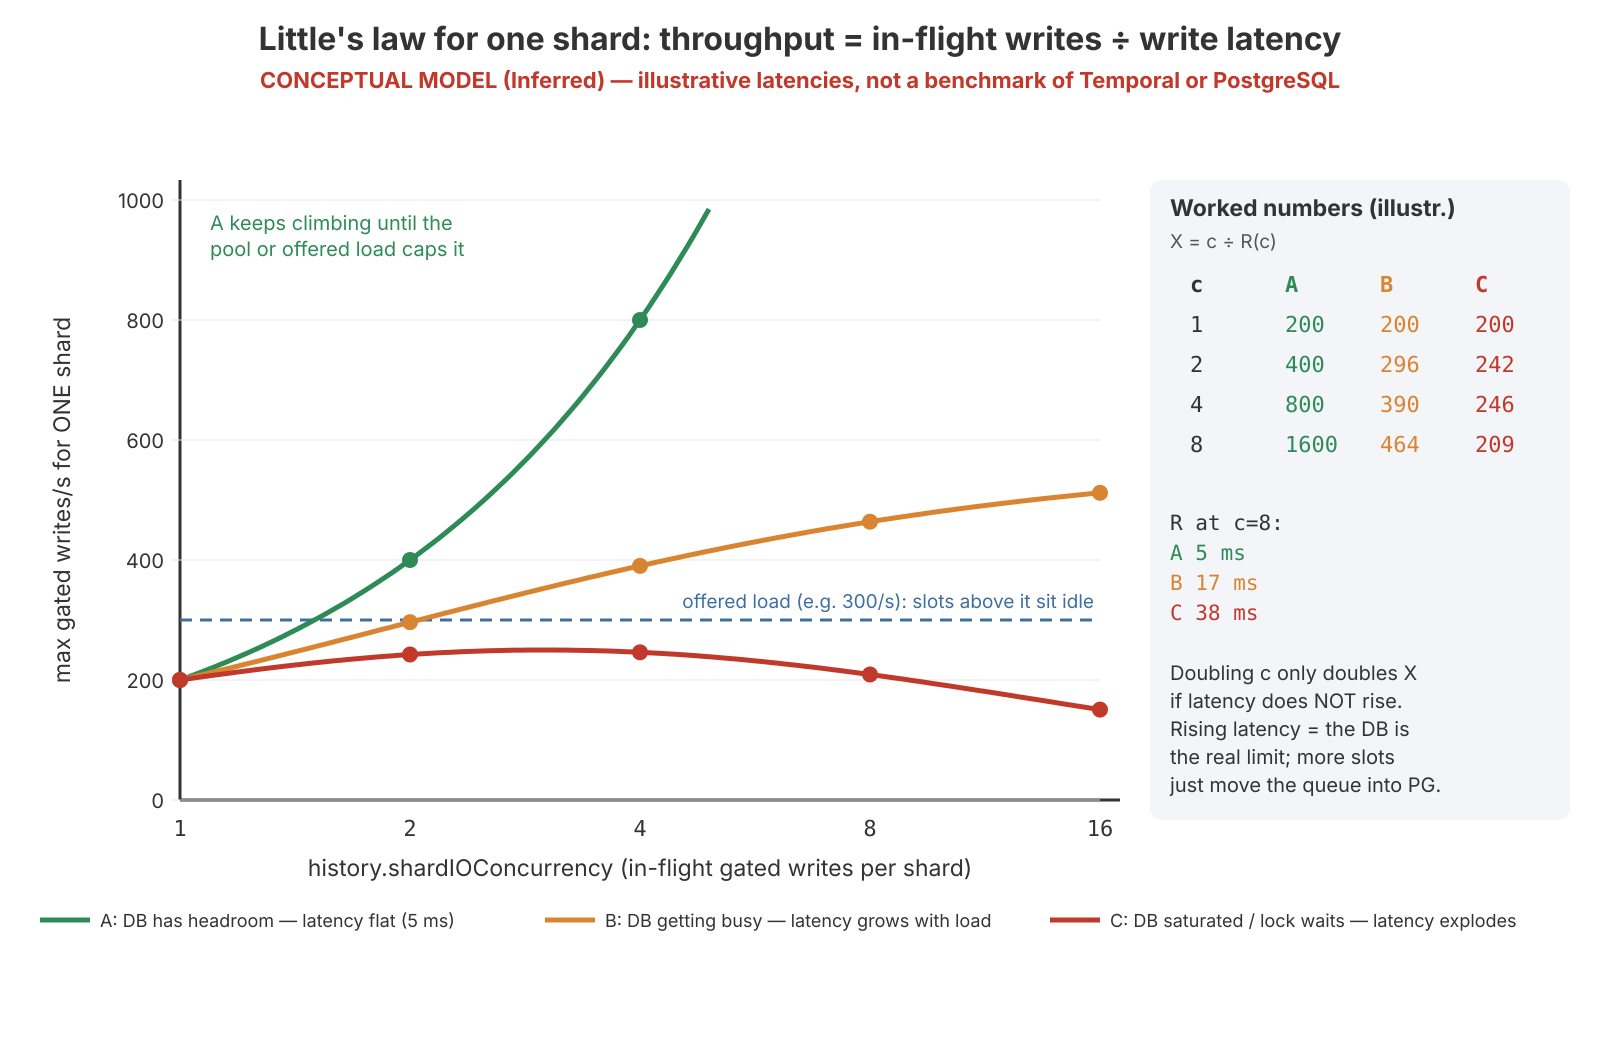
Illustrative numbers:
| Slots | A: PG idle, 5 ms flat | B: PG busy, 5 → 17 ms | C: PG saturated, 5 → 38 ms |
|---|---|---|---|
| 1 | 200/s | 200/s | 200/s |
| 2 | 400/s | ~296/s | ~242/s |
| 4 | 800/s | ~390/s | ~246/s |
| 8 | 1,600/s | ~464/s | ~209/s (worse) |
- A — the shard was mostly waiting on network and commit latency, not database work. Overlapping writes hides that latency, the same reason connection pools and pipelining help.
- B — each extra in-flight write adds real PostgreSQL work (CPU, WAL bytes, buffer and lock activity), so latency rises and each doubling buys less.
- C — past saturation, more concurrent transactions add contention without capacity: lock waits, WAL insert contention, pool waits, checkpoint pressure. Throughput falls, then
history.shardIOTimeout(5 s) turns slowness into retries that add more load.
Two PostgreSQL details push the same way. The checkpoint and ownership changes take the shards row FOR UPDATE and must wait out every in-flight FOR SHARE, so more slots means a longer wait for them. On the upside, group commit lets concurrent commits share one fsync — a real reason modest concurrency (2–4) helps on fsync-bound disks, until the disk's flush capacity runs out.
And the offered-load trap: if a shard only receives 30 writes/s at 5 ms, it uses on average 0.15 slots. Raising the cap from 1 to 8 does nothing. shardIOConcurrency only matters for shards that actually queue: hot shards and bursts.
The workflow lock comes first
More slots only let different workflows in the same shard overlap their writes. Two updates to the same workflow are always serialized by its lock, whatever shardIOConcurrency says. And the shard is fixed by the formula, so one workflow ID is always one door, whether there are 4 shards or 4,096.
A single hot workflow tops out at roughly 1 ÷ write latency — about 100 writes/s at 10 ms (illustrative). It shows up as BusyWorkflow resource-exhausted errors and lock waits, and its host looks hotter than the others, but adding hosts can't help: the shard has one owner. There's a size limit on top: defaults terminate a workflow at 51,200 events (limit.historyCount.error) or 50 MB (limit.historySize.error), with warnings at 10k / 10 MB. At 300 signals/s, if they all got in, that's about three minutes to termination.
The fix is in the application, not the cluster:
- Split the work —
order-sync-{region}ororder-sync-{hash(orderID) % 32}instead of oneorder-sync-global. Thirty-two doors, ~9 signals/s each, usually in 32 different shards. - Batch — one signal carrying 100 orders instead of 100 signals.
- Continue-as-new before the history hits the limit; that's covered in the timeouts, retries and determinism post.
Shards scale many workflows. They do nothing for one hot workflow.
When to add a slot, and how
All of these should be true together (thresholds are mine, from benchmarking, not Temporal-published):
- Slot wait p99 comparable to or larger than persistence p99 — e.g. persistence p99 8 ms,
semaphore_latencyp99 30 ms. Writes spend more time queuing than executing. - PostgreSQL has headroom: CPU below ~60–70%, commit latency flat, no growing lock waits.
- Connection pool well below 100%.
histogram_quantile(0.99, sum by (le, instance) (rate(lock_latency_bucket[5m])))
histogram_quantile(0.99, sum by (le, instance) (rate(semaphore_latency_bucket{operation="ShardInfo"}[5m])))
histogram_quantile(0.99, sum by (le, instance) (rate(persistence_latency_bucket{operation="UpdateWorkflowExecution"}[5m])))
max by (instance) (persistence_sql_in_use / persistence_sql_max_open_conn)
Signs you've gone too far: persistence p99 rises after the change and keeps rising with load; PostgreSQL commit latency and WAL sync time climb (pg_stat_wal); ungranted locks in pg_locks; the pool pinned at max; service_errors_resource_exhausted{resource_exhausted_cause="PersistenceLimit"} climbing (you just moved the queue into History's own rate limiter); state_transition_count flat or lower at the same load.
The procedure, staging first:
-
Baseline at the current value under realistic
omesload. -
Change one step, 1 → 2:
history.shardIOConcurrency: - value: 2 -
Roll History, one host at a time, waiting for
numshards_gaugeto settle andshard_closed_countto return to zero. -
Compare throughput, slot wait, persistence p99 and PostgreSQL metrics at the same load. Keep it only if throughput rose and persistence p99 stayed inside the SLO budget.
-
Repeat 2 → 4. Stop at the first step where persistence latency bends upward.
Step 3 is the trap. shardIOConcurrency lives in the dynamic config file, so you expect it to apply in seconds. It doesn't: it's read when the shard context is created. Until History restarts or the shard moves owner, every shard keeps its old semaphore. "I changed it and nothing happened for an hour" is the expected outcome of skipping the restart.
Cassandra forces it to 1, so this dial exists only on SQL backends; values of 2–8 are typical in SQL tuning, and only ever benchmark-derived.
The two dials side by side
persistence.numHistoryShards | history.shardIOConcurrency | |
|---|---|---|
| Controls | partitioning; max useful History hosts; number of one-at-a-time points | concurrent state-changing writes within one shard |
| Set in | static YAML, stored in cluster_metadata_info at first start | dynamic config, default 1 |
| Can change? | never — new cluster and migrate | any time, reversible |
| Takes effect | n/a | when shard contexts are re-created (restart or ownership move) |
| Main benefit | ceiling on parallelism; dilutes hot spots | hides DB latency for busy shards |
| Main cost | idle tax, forever | more concurrent load on PG; can push it past its knee |
| Helps one hot workflow? | no | no |
| Helps a saturated database? | no | no — makes it worse |
Reading the failure modes
| Symptom | Likely cause | First move |
|---|---|---|
ShardOwnershipLost outside deploys | membership flapping: network, long GC pauses, wrong broadcastAddress, an overloaded host missing gossip | check membership_changed_count, shard_closed_count, GC; set GOMEMLIMIT. Don't "fix" it by adding hosts |
| One host hot, shard counts balanced | hot shard(s) or a hot workflow | find the hot shard_id in the task tables, tdbg shard describe --shard-id <id> for the owner, then which workflow IDs dominate it |
| Slot p99 ≫ persistence p99 on all hosts, PG has headroom | too few slots for the load | raise shardIOConcurrency one step, roll History |
| Persistence p99 high everywhere, PG commit latency high | database-bound | scale or tune PostgreSQL; more shards or slots won't help |
| History CPU above ~70% everywhere, PG fine | CPU-bound History | add History hosts, one at a time |
The shard-level metrics I keep on a dashboard:
# Shards per host: should sum to numHistoryShards
max by (instance) (numshards_gauge{service_name="history"})

# Shard movement: should be ~0 outside deploys
sum by (instance) (increase(shard_closed_count{service_name="history"}[10m]))
sum by (instance) (increase(sharditem_created_count{service_name="history"}[10m]))

# How long acquiring a shard takes
histogram_quantile(0.99, sum by (le) (rate(sharditem_acquisition_latency_bucket[10m])))

# Fencing in action: stale-owner writes being rejected
sum by (instance) (rate(service_errors_shard_ownership_lost[5m]))
Names here match v1.32 metric_defs.go; check yours with curl -s http://<history-host>:9090/metrics | grep -E 'numshards|sharditem|shard_closed|ownership_lost|semaphore_latency'. My starting alerts, all to be replaced by your baselines: any sustained ownership-lost rate for 10 minutes outside a deploy window; repeated shard_closed_count outside deploys; shard spread max ÷ min above 1.3; History CPU above 70% sustained, which is what keeps N-1 headroom. (How the SDK side of these metrics gets into Prometheus is in my earlier post on SDK metrics.)
What I'd tell myself before go-live
- A shard is a box of workflows with one owner. Workflow → shard is a formula that never changes; shard → host changes whenever hosts come and go.
- The ring decides who should own a shard;
range_idin PostgreSQL decides who can write. Two hosts can believe; only one can commit. - Fencing is only as good as the
shardsrow's durability. No async-replica failover for the Temporal database, and restart History after a promotion. - Pick
numHistoryShardson purpose — 4096 is the sane default for production that may grow, measured against a 1024-shard staging run. Never 4. It's a birth decision; the YAML can't change it. - Adding History hosts spreads the same shards thinner. It never adds shards, never helps a hot shard, and never helps a saturated database.
- When something is slow, name the line: the workflow lock (
lock_latency), the shard slot (semaphore_latency), or PostgreSQL (persistence_latency). Each has a different fix. max writes/s ≈ shards × slots ÷ write latencyis a ceiling. More slots help only while PostgreSQL latency stays flat, only after a History restart, and never pastmaxConns.- Design for N-1: when a host dies, the survivors take its shards, its per-shard events cache and its load at the same moment.
Next in the series: Matching, task queues and workers — the other half of the server, where tasks wait on shelves for pollers.