Temporal on PostgreSQL: Two Commits per Step, Queue-Table Vacuum, and the Cache That Ate the CPU
On this page
- The servers forget, PostgreSQL remembers
- The table map
- A shard is a key prefix, not a table
- The tables that matter for load
- One step = two commits
- Why every transition pays at least one flush
- The chain: disk → commit → slot → queue → user
- What each operation costs
- One workflow with one activity, added up
- Why history_node gets huge
- Your payloads live in the history
- The retention ramp
- What PostgreSQL does with all this
- WAL: what fills the log
- Queue tables and autovacuum
- Why deleting doesn't shrink the disk
- Locks you'll actually see
- Reads are invisible until the cache is cold
- Visibility is a second database with a different cost profile
- What actually loads PostgreSQL
- Measuring it yourself
- The memory half: why History caches at all
- Go's GC, and what thrash looks like
- Incident: the cache that filled the room
- Why raising GOMEMLIMIT is the wrong fix
- Sizing the cache
- Three incidents that look alike
- GOMEMLIMIT vs the container limit
- The N-1 trap: per-shard caches grow when a node dies
- The other ways memory hurts
- Seeing it: metrics and pprof
- What I'd tell myself before go-live
TL;DR: Temporal Server keeps nothing that matters in its processes — PostgreSQL is the whole state. A shard is not a table; it's the first column of almost every primary key, which is why the shard count can never change. Each workflow step costs two commits, and each commit waits for a WAL flush while History holds one of the shard's
shardIOConcurrencyslots — so disk flush latency becomes user latency while PostgreSQL's CPU looks idle. The task tables are a transactional outbox (insert, then range-delete), which makes them textbook MVCC worst cases that need per-table autovacuum.history_nodeholds your payloads and grows until the cluster is older than its retention; deleting never shrinks the file, onlypg_repackdoes. On the memory side, History's mutable-state cache defaults to 128,000 entries — on a 2 GiB node it filled the Go heap over ~20 hours and the GC took 94% of CPU (3.6 cores). Capping it at 16,000 and restarting dropped it to 0.3 cores. RaisingGOMEMLIMITis not the fix, and per-shard caches double when a node dies.
The first time a History node pinned itself at 100% CPU, I went looking for the database. That's the reflex: Temporal is a machine that turns API calls into PostgreSQL transactions, so when Temporal is slow, PostgreSQL must be slow. It wasn't. PostgreSQL was idle, iowait was 0%, and the request rate was normal. The CPU was being spent by Go's garbage collector re-marking a cache that had quietly grown to fill the heap.
The opposite case happened too: persistence_latency doubled while PostgreSQL sat at 25% CPU, and the answer was the disk, not the queries. Both come down to what Temporal writes to PostgreSQL and what it keeps in memory to avoid reading it back. This post is both halves, with the incidents that taught me the difference.
Everything here is self-hosted Temporal on PostgreSQL. Table names and statement counts come from reading the main branch of temporalio/temporal (schema and common/persistence/sql/) and change between versions — I'll say where.
The servers forget, PostgreSQL remembers
Kill every Temporal process, start fresh ones on new machines pointed at the same database, and every workflow continues exactly where it was — timers still fire, scheduled activities are still scheduled. The flip side: nothing counts until PostgreSQL has committed it. Temporal doesn't acknowledge an activity completion until the change is on the database's disk. (The services themselves are covered in the Frontend and History post; here I only care about what they write.)
Before trusting any table list, check what your cluster actually has. Older schemas lack several newer tables (tasks_v2, history_immediate_tasks, history_scheduled_tasks, chasm_node_maps, current_chasm_executions, nexus_endpoints):
-- in the temporal DB
SELECT curr_version, min_compatible_version FROM schema_version;
\dt
\d executions
-- in the visibility DB
\d executions_visibility
SELECT count(*) FROM pg_indexes WHERE tablename = 'executions_visibility';
The table map
| What it is | Table(s) |
|---|---|
| Event history (the "notebook") | history_node (the pages), history_tree (branches per run) |
| Mutable state (the "status card") | executions plus side lists: activity_info_maps, timer_info_maps, child_execution_info_maps, signal_info_maps, request_cancel_info_maps, signals_requested_sets, buffered_events |
| Which run is current for a workflow ID | current_executions — enforces one open run per ID |
| History's task queues (outbox) | transfer_tasks, timer_tasks, visibility_tasks (+ replication_tasks) |
| Shard ownership and queue checkpoints | shards — one row per shard, range_id plus a protobuf blob of ack levels |
| Matching backlog | tasks / tasks_v2, task_queues / task_queues_v2 |
Search page (UI, temporal workflow list) | executions_visibility, usually in a separate database |
| Shard count, fixed forever | cluster_metadata_info |
| Ring membership | cluster_membership |
A shard is a key prefix, not a table
No table is created per shard. The shard number is the first column of the primary key:
executions        PRIMARY KEY (shard_id, namespace_id, workflow_id, run_id)
history_node      PRIMARY KEY (shard_id, tree_id, branch_id, node_id, txn_id)
transfer_tasks    PRIMARY KEY (shard_id, task_id)
timer_tasks       PRIMARY KEY (shard_id, visibility_timestamp, task_id)
A shard's rows are adjacent in every B-tree, so a queue reader's WHERE shard_id = $1 AND task_id >= $2 ORDER BY task_id LIMIT n is one index range scan. More shards never means more tables, just more key prefixes and more queue readers polling them. And since History computes farm.Fingerprint32(namespaceID + "_" + workflowID) % numHistoryShards + 1 up front, every statement is a point or range lookup on a known prefix — no cross-shard joins.
That shard_id column is the real reason the shard count is permanent: every row is already filed under its shard number. Change % 512 to % 1024 and the server would look in the wrong place for almost every workflow. At startup the server compares persistence.numHistoryShards in config with the value in cluster_metadata_info; depending on version it either warns and uses the stored value or refuses to start. Either way, the config can't change the real count. Choosing it is the subject of the shards post.
The tables that matter for load
executions is the hottest UPDATE table. One row per run; data and state are protobuf blobs (ExecutionInfo and ExecutionState), plus next_event_id and db_record_version — the "nobody else changed this card" counter. It's updated on every state transition, and because MVCC never updates in place, each transition writes a new row version containing the whole blob (TOASTed when large). Dead rows appear at the transition rate. HOT updates are possible because no indexed column changes — but only if the page has free room.
Loading a workflow that isn't in History's cache (GetWorkflowExecution) costs one SELECT on executions plus one per side list — about 9 statements on current main. Remember that number; it's why cold caches hurt.
history_node is append-mostly and the biggest table by bytes, because each row is a serialized batch of events including your payloads — workflow inputs, activity inputs and results, signal arguments.
transfer_tasks, timer_tasks, visibility_tasks are a transactional outbox. A task row is inserted in the same transaction as the state change that caused it, so they can never disagree. A per-shard queue processor reads them later (push to Matching, write visibility, fire a timer) and deletes them in ranges once the queue's ack level has passed. timer_tasks has a twist: rows can live for days (retention timers, long user timers), so it has a long-lived tail and a fast-churning head.
One detail I only found by reading the code paths: timer rows aren't deleted when they stop mattering. If an activity completes in 50 ms, its ActivityTimeout row still sits there until its visibility_timestamp; then the timer processor loads it, sees it's stale against the mutable state, drops it, and a later range delete removes it. So every activity costs an insert, a later read and a later range delete on timer_tasks even though nothing times out. (That's inferred from the code; verify with pg_stat_statements on your version.)
tasks / task_queues belong to Matching. tasks holds only work that couldn't be handed straight to a waiting poller — with workers keeping up (sync match) it has zero rows; under backlog it becomes another hot queue table. task_queues has one row per partition with a range_id lease, taken FOR UPDATE on every CreateTasks. Sync vs backlog match is covered in the Matching post.
shards has only numHistoryShards rows but is very hot: every workflow-changing transaction takes SELECT ... FOR SHARE on its shard row. The data column is a binary protobuf — you can't split_part the owner out of it; use tdbg shard describe --shard-id N.
One step = two commits
Every time a workflow moves forward — a task completes, a signal arrives, a timer fires — History does this for UpdateWorkflowExecution:
-- (A) events first, OUTSIDE the state transaction (autocommit, 1 commit)
INSERT INTO history_node (shard_id, tree_id, branch_id, node_id, prev_txn_id, txn_id, data, data_encoding)
VALUES (...) ON CONFLICT (shard_id, tree_id, branch_id, node_id, txn_id) DO UPDATE SET ...;

-- (B) the state transaction (1 commit)
BEGIN;
  SELECT range_id FROM shards WHERE shard_id = $1 FOR SHARE;          -- fencing: must equal my range_id
  SELECT db_record_version, next_event_id FROM executions
   WHERE shard_id=$1 AND namespace_id=$2 AND workflow_id=$3 AND run_id=$4 FOR UPDATE;
  UPDATE executions SET data=..., state=..., next_event_id=..., db_record_version=... WHERE ...;
  -- only when state/run changes: current_executions FOR UPDATE + UPDATE
  INSERT INTO activity_info_maps / timer_info_maps / ...;   DELETE FROM ..._maps ...;
  INSERT INTO transfer_tasks / timer_tasks / visibility_tasks (...);   -- the outbox
COMMIT;   -- WAL flush before Temporal replies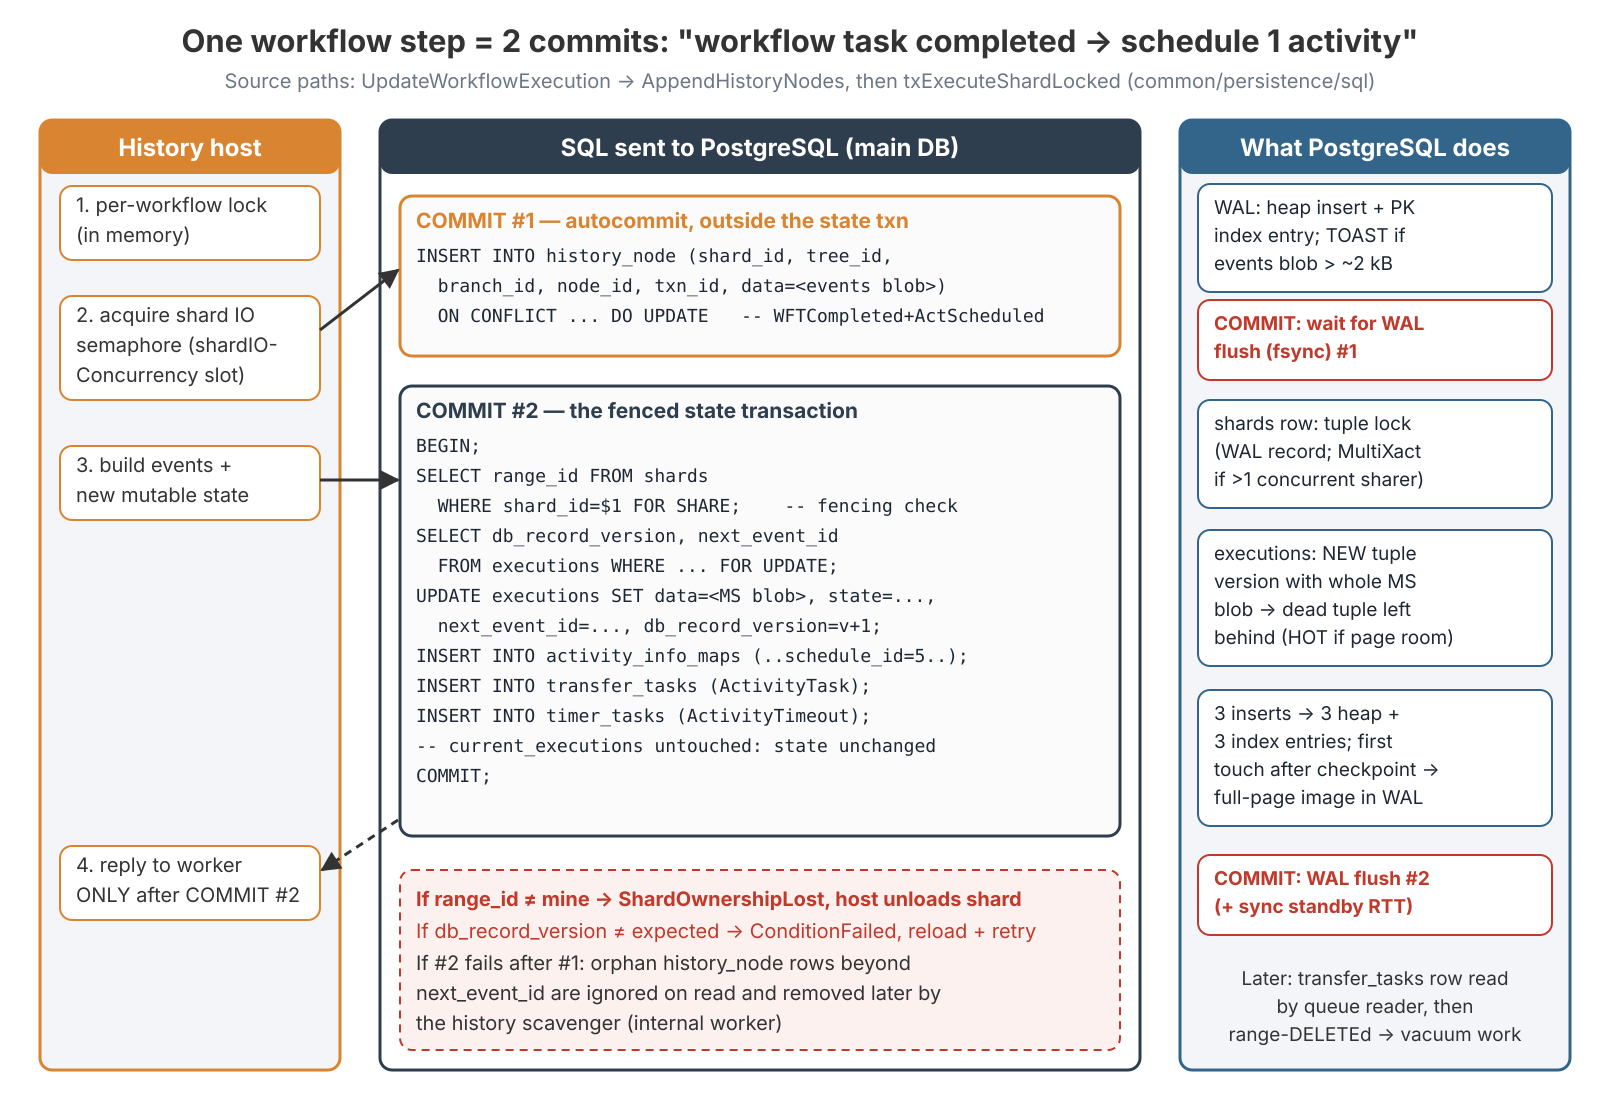
What each piece is doing:
- Fencing is a row lock plus a comparison. If
shards.range_iddoesn't match what this host got when it acquired the shard, the transaction aborts withShardOwnershipLostErrorand the host drops the shard. Two hosts that both believe they own a shard can never both write. FOR SHAREon the shard row lets several workflow transactions on the same shard run concurrently — exactly whatshardIOConcurrency > 1allows. Acquiring a shard and periodically saving shard info (history.shardUpdateMinInterval, 5 min default) useFOR UPDATE, which waits for in-flight sharers and briefly blocks new ones.- The
executionslock isFOR UPDATEplus a version check. History already serialises each workflow in memory with a per-workflow lock, so contention is rare; a mismatch means "my cached state is stale" — reload and retry, visible asConditionFailedinpersistence_errors. - Events go first. If (B) fails after (A) succeeded, the history has orphan rows past
next_event_id. They're ignored on read and cleaned up later by the history scavenger, a system workflow on the internal worker.
Why every transition pays at least one flush
With synchronous_commit = on (the default), COMMIT returns only after the WAL is fsynced to the primary's disk — and with synchronous replication, after the standby confirms too. So:
min latency of one workflow step ≈ RTT(app↔DB) × statements
                                 + WAL flush (commit A) + WAL flush (commit B)
                                 [+ sync-replica round trip × 2, if synchronous replication]
Disk flush latency is a hard floor on step latency. A slow fdatasync — network block storage, a burst-credit volume that ran out of credits — shows up as persistence_latency{operation="UpdateWorkflowExecution"} rising while PostgreSQL CPU stays low. Group commit helps: commits arriving together share a flush, which is why throughput keeps rising with concurrency until the WAL device or the WALWrite lock saturates. commit_delay / commit_siblings can increase batching, but tune them only from a benchmark — they add latency at low load.
synchronous_commit = off takes the flush out of the path, and some operators run Temporal that way. What it costs: on a PostgreSQL crash, roughly the last 3 × wal_writer_delay of acknowledged commits can vanish — a start, a signal or an activity completion the caller was told succeeded. Fencing and consistency still hold; durability of acknowledged steps doesn't. I treat that as a risk decision with a named owner, not a tuning knob.
The chain: disk → commit → slot → queue → user
Every commit happens while History holds one of the shard's shardIOConcurrency slots. So a slow disk makes commits slow, a slow commit holds the slot longer, a slot held longer makes the queue for it longer, and that queue is what users feel.
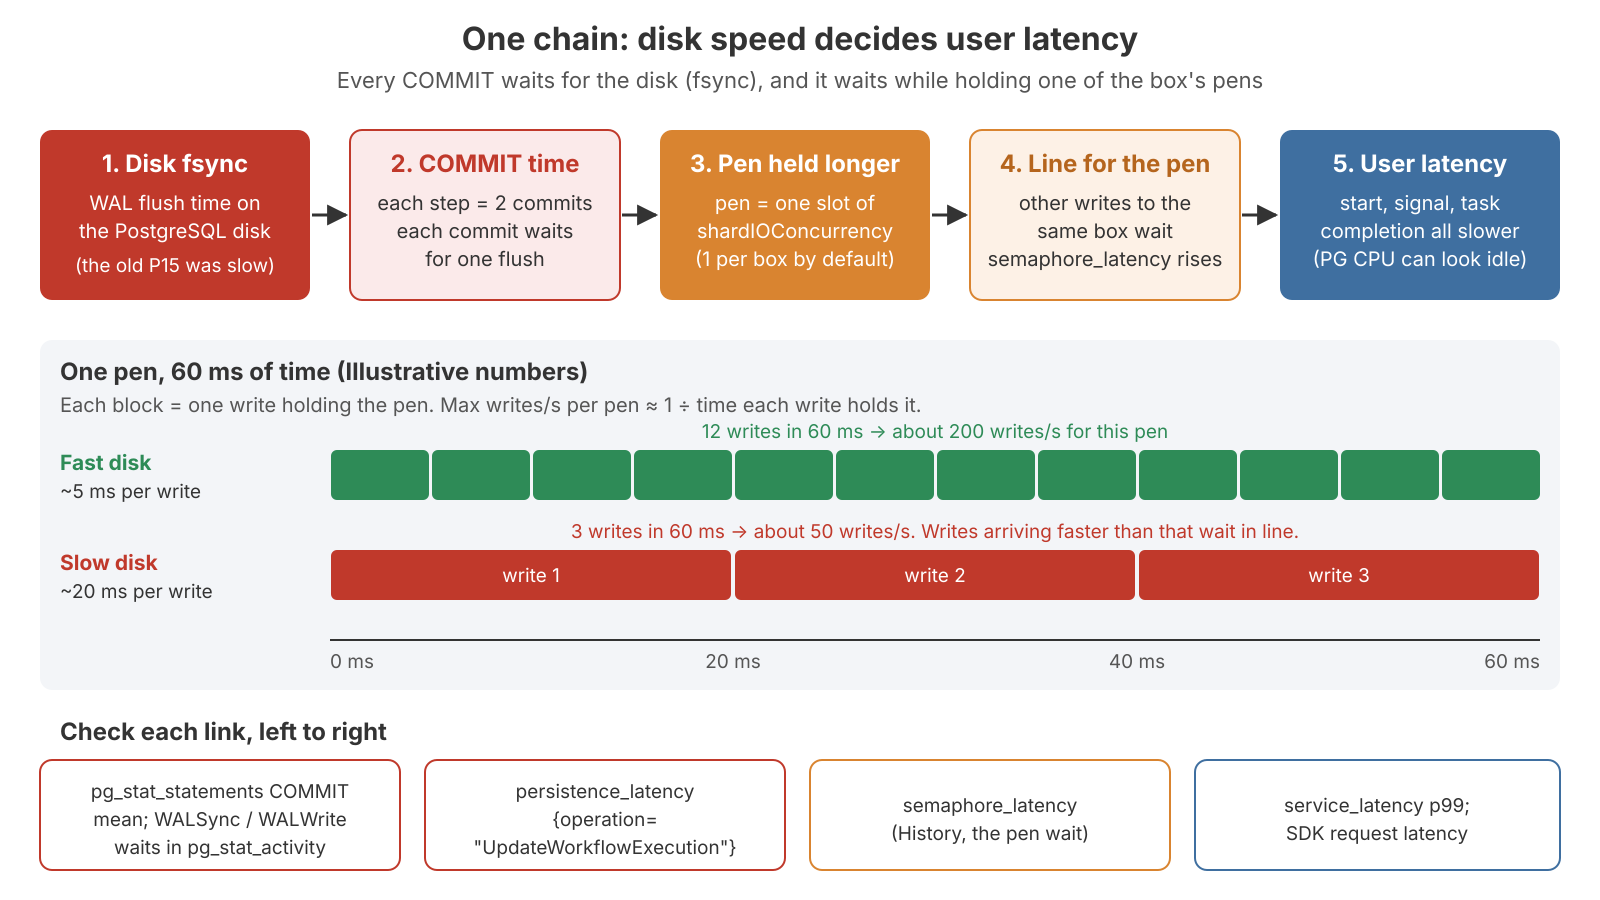
It's Little's law:
max writes/s ≈ shards × shardIOConcurrency ÷ time each write holds the slotWith 4 shards and 1 slot each at ~10 ms per write, the ceiling is about 400 writes/s (illustrative numbers). Double the time per write and the ceiling halves. On one of our clusters the database sat on an old, slow managed disk, and that disk was the bottleneck long before any Temporal setting was — every commit held a slot longer, and the queue for the slots grew. A faster disk can be worth more than any Temporal knob. The slots themselves are explained in the shards and shardIOConcurrency post.
What each operation costs
Approximate, from reading main with sync match, a warm cache, no archival or replication, and a separate visibility database; counts change between versions. Most steps are exactly the two commits above. The exceptions: activity started is one commit with no history event — ActivityTaskStarted is written only when the activity finishes, which keeps retries out of the history. Poll with sync match writes nothing, because Matching hands the task to a waiting poller in memory; a backlogged poll adds a tasks insert and a task_queues row lock per task. Retention delete is ≈ 4 commits. Shard acquire is 1–2 commits plus a read burst: queue rescans and ~9 SELECTs per workflow touched.
Two background facts are easy to miss. First, range deletes are shared: queue processors save an ack level (history.transferProcessorUpdateAckInterval, 30 s) and then delete everything below it in one statement (DELETE FROM transfer_tasks WHERE shard_id = $1 AND task_id >= $2 AND task_id < $3). Cheap per row, but each one is a burst of dead rows. Second, idle shards still poll: each shard's queue readers query at least every history.transferProcessorMaxPollInterval / visibilityProcessorMaxPollInterval (1 min) and timerProcessorMaxPollInterval (5 min) even with zero traffic. With 4096 shards and 3–4 queue types that's tens of queries per second before any workflow runs.
One workflow with one activity, added up
| # | Step | Commits | history_node rows | Task rows inserted |
|---|---|---|---|---|
| 1 | Start | 2 | 1 | transfer 1, visibility 1 |
| 2 | WFT 1 started | 2 | 1 | timer 1 |
| 3 | WFT 1 completed → schedule activity | 2 | 1 | transfer 1, timer ~1 |
| 4 | Activity started | 1 | 0 | timer 0–1 |
| 5 | Activity completed | 2 | 1 | transfer 1 |
| 6 | WFT 2 started (sticky) | 2 | 1 | timer 1 |
| 7 | WFT 2 completed → complete workflow | 2 | 1 | transfer 1, visibility 1, timer 1 |
| Live total | ≈ 13 | 6 | ≈ 10–12, all range-deleted later | |
| 8 | Retention, days later | ≈ 4 | range-delete 6 | visibility 1 |
That's ≈ 7 state transitions and ≈ 13 commits — about 1.9 commits per transition, matching the two-commits rule — plus roughly 30–35 row writes live and ≈ 25 deletes later. So "1,000 workflows/s of this shape" is really ≈ 7,000 state transitions/s ≈ 13,000 main-DB commits/s. That's why I plan capacity in state transitions, not workflows; the planning side is in the metrics and capacity post.
Why history_node gets huge
Your payloads live in the history
Every activity input and result is stored inside the events, as are workflow inputs, signal arguments and child results. A workflow that passes a 400 KB JSON between activities stores it several times — once as each activity's input, once as each result — and then ships every copy to workers, into their sticky caches, into History's cache, and out again on every replay.
There are hard limits as well (defaults; verify on your version under limit.*, e.g. limit.blobSize.error, limit.historySize.error):
| Limit | About | Where it bites |
|---|---|---|
| One payload | 2 MB | The command carrying it fails |
| One gRPC message | 4 MB | Large histories or batches fail to transfer |
| One workflow history | 50 MB / 51,200 events | The workflow is terminated past the error limit |
The rule I give every team: the history stores decisions and small data, not files. Put the blob in S3 or Azure Blob Storage and pass a key like "invoices/42.pdf".
The retention ramp
At close, History drops a DeleteHistoryEvent timer due at close time + retention. When it fires, History deletes the run's state, side lists, history and visibility row. On a brand-new cluster nothing is old enough to delete yet, so the table only grows until the cluster is older than the retention period. After that, deletes balance writes:
steady-state size ≈ daily data written × retention daysAfter we cut over to a new 512-shard cluster, history_node went from 76 GB to 162 GB and looked exactly like a leak. It was the ramp. If growth continues well past the retention period, then it's real: either daily volume is growing, or deletes are falling behind — retention deletes read the run's whole history and log a WAL record per row, so on a slow disk they can lose the race against new writes.
Two traps:
- Lowering retention doesn't delete what already closed. The delete time was fixed at close, using the retention in force then.
temporal operator namespace update --retention 7donly affects workflows that close afterwards. Dropping from 30 days to 7 to "free 50 GB now" frees nothing now. - Even when deletes run,
dfdoesn't move — next section.
What PostgreSQL does with all this
WAL: what fills the log
In rough order, Temporal's WAL drivers are:
- Mutable-state rewrites.
UPDATE executionswrites a whole new row; a TOASTed blob is rewritten in full. A workflow with many pending activities or big memo/search attributes pays its full state size in WAL on every transition. Watchmutable_state_size. - History rows. 100 kB payloads mean about 100 kB of WAL per step, plus TOAST.
- Full-page writes. The first change to each 8 kB page after a checkpoint logs the whole page. Temporal's writes are spread across thousands of shard prefixes and many indexes, so WAL spikes after every checkpoint. A longer
checkpoint_timeout/ largermax_wal_sizemeans fewer FPWs (and longer crash recovery);wal_compression(lz4/zstdon PG15+) shrinks them a lot. - Index maintenance, row-lock records and deletes — index entries are cheap on the main tables (mostly just the primary key) and very expensive on visibility; every
FOR SHARE/FOR UPDATEemits aHEAP_LOCKrecord; every deleted row is a record.
-- WAL bytes, records and full-page images since reset (PG14+; columns changed in PG18 — check \d pg_stat_wal)
SELECT wal_records, wal_fpi, pg_size_pretty(wal_bytes) AS wal, stats_reset FROM pg_stat_wal;
Queue tables and autovacuum
The outbox tables are the textbook worst case for MVCC: append at the tail, range-delete at the head. Between the delete and the vacuum, dead index entries sit exactly where the queue reader starts its scan (task_id >= ack_level). When autovacuum lags, GetHistoryTasks / GetTransferTasks latency rises, dispatch slows, and schedule-to-start climbs with nothing obviously wrong. So in a very real sense autovacuum is part of Temporal's throughput.
The default autovacuum_vacuum_scale_factor = 0.2 — vacuum when 20% of the table is dead — is far too lazy for a table that's mostly dead all the time. These are the per-table starting points I use; they're common operational values to benchmark, not Temporal-published ones:
ALTER TABLE transfer_tasks   SET (autovacuum_vacuum_scale_factor = 0.0, autovacuum_vacuum_threshold = 5000,
                                  autovacuum_vacuum_cost_limit = 2000);   -- fixed dead-row trigger, work harder
ALTER TABLE timer_tasks      SET (autovacuum_vacuum_scale_factor = 0.01); -- long-lived tail, small percentage
ALTER TABLE visibility_tasks SET (autovacuum_vacuum_scale_factor = 0.0, autovacuum_vacuum_threshold = 5000);
ALTER TABLE tasks            SET (autovacuum_vacuum_scale_factor = 0.0, autovacuum_vacuum_threshold = 5000);
ALTER TABLE executions       SET (autovacuum_vacuum_scale_factor = 0.02, fillfactor = 85);  -- fillfactor: new pages only
The fillfactor on executions leaves room on each page so updates can be HOT and skip the primary-key index. Check that autovacuum_max_workers (default 3) is enough for this many busy tables, and that no long-running transaction is holding back the xmin horizon — otherwise vacuum runs and reclaims nothing.
SELECT relname, n_live_tup, n_dead_tup, n_tup_hot_upd, n_tup_del, last_autovacuum, autovacuum_count
FROM pg_stat_user_tables
WHERE relname IN ('executions','history_node','transfer_tasks','timer_tasks','visibility_tasks',
                  'tasks','tasks_v2','shards','activity_info_maps','current_executions')
ORDER BY n_dead_tup DESC;

SELECT * FROM pg_stat_progress_vacuum;
If transfer_tasks shows tens of millions of dead rows and GetHistoryTasks p99 has tripled, that's this chain: range deletes left dead entries at the head, autovacuum hasn't run, the reader walks dead entries before finding live ones.
Why deleting doesn't shrink the disk
DELETE marks rows dead; VACUUM makes the space reusable inside the table; the file stays the same size. Only a rewrite returns space to the OS, and on a live Temporal database only one rewrite is acceptable:
| Tool | What it does | On live Temporal |
|---|---|---|
VACUUM FULL | Rewrites compactly under an ACCESS EXCLUSIVE lock for the whole rewrite | No — Temporal stalls on that table |
pg_repack | Builds a compact copy while reads and writes continue (trigger-tracked), locks only briefly at start and swap | Yes, off-peak |
pg_repack needs free disk about the size of the table plus its indexes, and it must not run at peak: it competes for the same disk every Temporal commit waits on, so by the chain above it raises persistence_latency and semaphore_latency even though it holds no long lock. I went through the three options in detail in VACUUM vs VACUUM FULL vs pg_repack. Retention waves make this worse: workflows started together get retention timers that fire together, producing a mass delete, a vacuum spike and possibly long-term bloat in history_node.
Locks you'll actually see
| Lock | Taken by | What contends |
|---|---|---|
shards row, FOR SHARE | every workflow-changing transaction | Sharers don't block each other; the periodic FOR UPDATE waits for all of them. With shardIOConcurrency > 1 several transactions share the row at once, which (from PostgreSQL internals) forces MultiXact creation — watch mxid_age(datminmxid) and pg_stat_slru |
executions row, FOR UPDATE | every update | Rare; a conflict is a stale cache (ConditionFailed) |
current_executions row | start, close, continue-as-new, reset | Only on workflow-ID reuse storms |
task_queues row, FOR UPDATE | every backlog CreateTasks | Serialises backlog writes per partition — one more reason partitions matter |
WALInsert, WALWrite, WALSync | every commit | The real global bottleneck at high commit rates |
-- Who is waiting on what
SELECT wait_event_type, wait_event, state, count(*)
FROM pg_stat_activity
WHERE datname IN ('temporal','temporal_visibility') AND backend_type = 'client backend'
GROUP BY 1,2,3 ORDER BY 4 DESC;

-- MultiXact and XID age
SELECT datname, mxid_age(datminmxid) AS multixact_age, age(datfrozenxid) AS xid_age FROM pg_database;
Reads are invisible until the cache is cold
Steady-state reads are mostly queue range scans and history reads for workflow tasks. They explode when caches are cold: after shards move, when workers lose their sticky cache and re-read full histories, and with large histories. That's why scaling events themselves spike database load — and the bridge to the memory half.
Visibility is a second database with a different cost profile
Visibility answers list, count and search — the UI, temporal workflow list, ListWorkflowExecutions, CountWorkflowExecutions. History writes it asynchronously through visibility_tasks, so it's eventually consistent. It's its own datastore (persistence.visibilityStore) with its own connection pool.
It's cheap to insert into and very expensive to update. On current main, executions_visibility has about 70 secondary indexes (73 when I counted) — one per predefined or custom search-attribute column plus system columns, typically shaped (namespace_id, <col>, COALESCE(close_time,'9999-12-31') DESC, start_time DESC, run_id), some GIN. A non-HOT update inserts into every index, and closing a workflow changes close_time and status, which appear in nearly every index. Every close writes ~70 index entries, plus WAL and FPWs for each touched page. Reads aren't free either: count queries, status filters over big namespaces and LIKE-style search-attribute filters can scan large parts of the table, and a UI left open on a busy namespace keeps issuing list queries.
What I do:
- Visibility always in a separate database, and a separate PostgreSQL instance at scale, so list storms and index maintenance can't steal WAL bandwidth and buffer cache from the main write path.
- No casual custom search attributes — each one used feeds a generated column and an index.
- Watch
service_latencyforListWorkflowExecutions|CountWorkflowExecutionson Frontend and the visibility DB's top statements.
SELECT pg_size_pretty(pg_relation_size('executions_visibility')) AS heap,
       pg_size_pretty(pg_indexes_size('executions_visibility'))  AS all_indexes,
       (SELECT count(*) FROM pg_indexes WHERE tablename='executions_visibility') AS n_indexes;
What actually loads PostgreSQL
Ranked, for typical payloads of a few kB (inferred from the write path; your workload can reorder it): the commit rate (≈ 2 × state transitions/s, saturating first on fast-CPU, slow-fsync storage); bytes per step (payloads, full mutable-state rewrites, FPWs); queue-table churn and vacuum; Matching backlog (an extra transaction per task, serialised per partition — watch poll_success_sync ÷ poll_success); visibility writes and queries; cold-cache reloads; retention waves; and a background baseline of idle shard polls and heartbeats that scales with shards and hosts. The levers follow directly: fewer steps per business outcome, small payloads, a faster WAL device, per-table autovacuum, enough pollers for sync match, and visibility on its own instance.
Measuring it yourself
To replace these approximations with your own numbers: enable pg_stat_statements in both databases with track_utility = on (so COMMIT shows up), take an idle baseline on a staging cluster with production's version and shard count, reset, run exactly N workflows (I use omes with --scenario workflow_with_single_noop_activity --iterations 10000), let everything drain, and subtract the baseline.
SELECT pg_stat_statements_reset(); SELECT pg_stat_reset();

-- statements per workflow (N = 10000)
SELECT calls / 10000.0 AS per_wf, rows / 10000.0 AS rows_per_wf,
       round(mean_exec_time::numeric, 3) AS mean_ms, left(query, 90) AS q
FROM pg_stat_statements
WHERE dbid = (SELECT oid FROM pg_database WHERE datname = current_database())
ORDER BY calls DESC LIMIT 30;

SELECT xact_commit / 10000.0 AS commits_per_wf FROM pg_stat_database WHERE datname = 'temporal';
SELECT pg_size_pretty(wal_bytes / 10000) AS wal_per_wf, wal_fpi / 10000.0 AS fpi_per_wf FROM pg_stat_wal;
And the Temporal side for the same window:
# State transitions per second
sum(rate(state_transition_count_count[5m]))
# Persistence p99 by operation, History only (includes connection-pool wait)
histogram_quantile(0.99, sum by (le, operation) (rate(persistence_latency_bucket{service_name="history"}[5m])))
# Slot wait (shardIOConcurrency semaphore)
histogram_quantile(0.99, sum by (le) (rate(semaphore_latency_bucket{service_name="history", operation="ShardInfo"}[5m])))
# Commits per state transition (postgres_exporter; metric name depends on exporter version)
sum(rate(pg_stat_database_xact_commit{datname="temporal"}[5m])) / sum(rate(state_transition_count_count[5m]))
Operation label values change between releases; discover yours with curl -s http://<host>:9090/metrics | grep -o 'operation="[^"]*"' | sort -u. One more persistence knob worth setting explicitly: persistence.datastores.<name>.sql.maxConns. Unset means Go's database/sql default — unlimited open connections — multiplied by every Temporal host. Every open connection is a forked PostgreSQL backend, so the arithmetic from the PgBouncer post applies: pool size × Temporal hosts × services is your backend count. And history.persistenceMaxQPS (9000 per host on main) is the other half: too low and History throttles itself while PostgreSQL is idle.
The memory half: why History caches at all
Every step needs the workflow's mutable state. Reading it from PostgreSQL every time would be the 9-statement reload on every step, so each History node keeps two caches:
| Cache | Holds | Default (version-dependent) | Key |
|---|---|---|---|
| Mutable-state cache | per-workflow state, and the per-workflow lock | 128,000 entries per node (v1.25+) | history.hostLevelCacheMaxSize |
| Events cache | recent history events | 512 KiB per shard, or 256 MiB per node in host-level mode | history.eventsCacheMaxSizeBytes / history.eventsHostLevelCacheMaxSizeBytes |
The cache scope has moved around across versions, and it matters for sizing:
- v1.22 and earlier: per-shard mutable-state cache only (
history.cacheMaxSize, 512 entries per shard), so memory grows with shards per host. - v1.23–v1.24:
history.enableHostHistoryCacheexists but defaults to false. - v1.25–v1.28: it defaults to true — one host-level cache of 128,000 entries.
- v1.29+: the per-shard key and the switch are gone; host-level only.
- Events cache: per shard unless
history.enableHostLevelEventsCacheis true, which defaults to false through v1.32 and true onmain.
Verify on your tag with grep -n 'enableHostHistoryCache\|cacheMaxSize' common/dynamicconfig/constants.go. With defaults, 1 host owning 4096 shards has a per-shard events cache of up to ~2 GiB, and on v1.24 or older a per-shard mutable-state cache of up to ~2.1M entries — likely an OOM.
The trade is plain: bigger cache, fewer GetWorkflowExecution reads; smaller cache, every miss makes a step wait on PostgreSQL before it can start. And when shards move, the new owner's cache is cold for those workflows — expect elevated PG reads and History p99 for a few minutes after every move. Restarting hosts in a tight loop means caches never warm at all.
Go's GC, and what thrash looks like
Temporal is Go, and GOMEMLIMIT tells the runtime how big its room is. The closer the heap gets to that limit, the more often the GC runs. The GC has to mark all live data each cycle; if live data alone is close to the limit, each cycle frees almost nothing and the next starts almost immediately.
heap 30% of limit                        -> GC now and then           -> CPU on real work
heap 95% of limit                        -> GC very often             -> much CPU spent collecting
heap ~100%, mostly live data             -> GC nonstop, frees ~nothing -> 100% CPU, ~0 useful work
That last line is GC thrash. In a CPU profile it's runtime.gcDrain / runtime.gcBgMarkWorker at the top. Two details matter later: GOMEMLIMIT is a soft limit that doesn't include the page cache (the binary's own code pages, mapped files) or non-Go memory; and on Go 1.25+ GOMAXPROCS follows the cgroup CPU limit, while on older Go you set it explicitly if you use CPUQuota=.
Incident: the cache that filled the room
The opening story. One History node, 2 GiB, 100% CPU, 0% iowait, PostgreSQL idle, normal request rate. Fine after every restart, then steadily worse over about 20 hours.
What was happening: the mutable-state cache was at its default 128,000 entries — far too many for a 2 GiB node. After a restart it's empty and everything is fast. As workflows run, entries accumulate hour after hour; nothing is wrong, the cache is doing its job. After ~20 hours the cache fills the Go heap and the GC never stops. The profile showed runtime.gcDrain at 94% of CPU.
The fix:
# dynamic config — read at startup, so restart History after changing it
history.hostLevelCacheMaxSize: 16000
Then a restart, because the cache is built when the node starts. CPU went from 3.6 cores to 0.3. The restart part is not optional: all History cache keys are read at init (since roughly v1.31 their descriptions literally say "Requires service restart to take effect"). Lower the value in dynamic config, skip the restart, and an hour later you're still at 100% CPU wondering why the change didn't work.
Why raising GOMEMLIMIT is the wrong fix
A bigger room just lets the cache grow further before the same cliff — 128,000 is a ceiling, not a target, and the cache will fill whatever you give it. Worse, pushing GOMEMLIMIT toward the container limit causes a different incident, below.
Sizing the cache
There's no published formula. I measure the average entry size (heap in use ÷ cache_usage at a steady point, minus a small-cache baseline), decide the cache's share of the process budget after goroutines, queues, the events cache and GC headroom, and divide — or better, set a byte limit directly (below). Then I watch misses: if the GetWorkflowExecution rate climbs toward the UpdateWorkflowExecution rate, the cache is now smaller than the working set.
Three incidents that look alike
All three presented as "Temporal is slow and the CPU is busy". Causes and fixes had nothing in common.
| Incident | What I saw | Real cause | Fix |
|---|---|---|---|
| iowait storm | 88% iowait, heavy disk reads | GOMEMLIMIT too close to the cgroup's MemoryHigh; the kernel kept evicting Temporal's own executable pages and re-reading them | GOMEMLIMIT ≈ 2/3 of MemoryHigh |
| cache fill | 100% CPU, 0% iowait, growing over ~20 h | mutable-state cache at 128k on a 2 GiB node | cache 16,000 + restart |
| poller storm | 99% CPU at only 35 req/s | 4,100 waiting worker long polls holding memory on Frontend and Matching | fewer worker pollers, GOMEMLIMIT 2400 MiB |
Two questions separate them:
- Is iowait high? Then the memory limits are wrong (the iowait storm).
- High CPU, low iowait? It's the GC. Then: who is filling memory, and how fast? The cache fills slowly, as more workflows are touched — look at
cache_usage{cache_type="mutablestate"}. Long polls fill memory immediately, as soon as workers connect, and scale with the number of pollers rather than traffic — which is how two services burned 99% CPU at 35 req/s. The poller arithmetic is in the Matching and workers post.
GOMEMLIMIT vs the container limit
Under systemd, MemoryHigh= is where the kernel starts reclaiming hard from the cgroup, and MemoryMax= is the OOM kill. GOMEMLIMIT steers only the Go heap, but the cgroup's usage also counts page cache — including the executable's code pages. Let the heap grow up to MemoryHigh and the kernel reclaims the only thing it can, the page cache, so the process faults its own code back in from disk over and over: high iowait, heavy reads, everything slow.
| Situation | Starting point |
|---|---|
MemoryHigh set | GOMEMLIMIT ≈ 2/3 of MemoryHigh — what fixed our iowait storm |
Only a hard limit (MemoryMax, a Kubernetes limit) | GOMEMLIMIT ≈ 80–90% of it (common rule of thumb) |
| Separate processes per role | Re-derive per process: History gets most of the RAM; Frontend and the internal worker need little |
# systemd drop-in for a History unit (illustrative sizes for a 3 GiB budget)
[Service]
MemoryHigh=3G
MemoryMax=3500M
Environment=GOMEMLIMIT=2GiB
The trap to remember: GOMEMLIMIT is a hint to the GC, not a cap on what the cache can hold. If live data exceeds it, Go exceeds it, and the cgroup deals with you instead — iowait at MemoryHigh, OOM kill at MemoryMax. Cap the caches so the heap never needs to reach GOMEMLIMIT in normal running.
The N-1 trap: per-shard caches grow when a node dies
Two History nodes share 1,024 shards, 512 each. The events cache is per shard by default through v1.32: 512 KiB × shards owned.
normal:  512 shards × 512 KiB   ≈ 256 MiB per node
B dies:  1,024 shards × 512 KiB ≈ 512 MiB on A       (2×, at 2× the work)
The survivor's memory doubles at exactly the moment its work doubles, on a node sized for half. Worst case it hits GC thrash or an OOM kill, and one node failure becomes a full outage. The fix is to size caches per host, in bytes:
# dynamic config — all read at startup; restart History after changing
history.enableHostLevelEventsCache: true          # one events cache per node, not per shard
history.eventsHostLevelCacheMaxSizeBytes: 128MiB  # default 256 MiB when host-level is on
history.cacheSizeBasedLimit: true                 # limit the mutable-state cache in bytes, not entries
history.hostLevelCacheMaxSizeBytes: 256MiB
16,000 entries could be small or huge depending on workflow shape; 256 MiB is always 256 MiB. These are the values I used — size them to your node and verify key names with grep -n 'HostLevelCache\|cacheSizeBasedLimit\|eventsCache' common/dynamicconfig/constants.go. On v1.24 and older the same trap applies to the per-shard mutable-state cache. And test it: kill one History node in staging under load and watch the survivors' memory_heap, GC pauses and RSS. That number is the real input to an N-1 capacity plan; the drills are in the failure drills post.
The other ways memory hurts
Cache thrash is the opposite problem: the working set is bigger than the cache, entries are evicted before reuse, and every step reloads from PostgreSQL. Signal: GetWorkflowExecution high in persistence_requests, high miss metrics. Fix: a bigger host-level cache if RAM allows (restart), or more History hosts to split the working set. Huge histories make every entry expensive — continue-as-new earlier, smaller payloads (timeouts, retries and determinism covers continue-as-new).
GC pauses that flap the ring. A long GC pause (or CPU throttling, a noisy neighbour, swap) can stop a node answering membership pings; the ring marks it suspect, then faulty, its shards move away, it rejoins, they move back — and every move means cold caches and more DB load, so the churn feeds itself. The signal is latency spikes lining up with membership_changed_count and one host with high memory_gc_pause_ms; the fix is removing the slowness on that host, not adding hosts (Temporal exposes no ringpop timeout to loosen). Details in the cluster membership post.
Seeing it: metrics and pprof
# Cache fill per History host — watch it climb after a restart
max by (instance) (cache_usage{cache_type="mutablestate"})
# Miss pressure: loads vs updates (should be small)
sum by (instance) (rate(persistence_requests{operation="GetWorkflowExecution"}[5m]))
  / sum by (instance) (rate(persistence_requests{operation="UpdateWorkflowExecution"}[5m]))
# Heap vs GOMEMLIMIT, GC pause p99, goroutines (long polls pile up on Frontend/Matching)
max by (instance) (memory_heap)
histogram_quantile(0.99, sum by (instance, le) (rate(memory_gc_pause_ms_bucket[5m])))
max by (instance) (num_goroutines)
Use cache_usage, not cache_size — the latter reports different things on different versions. On the host:
vmstat 1 5                                                                    # the first question: iowait ("wa")
cat /sys/fs/cgroup/system.slice/temporal-history.service/memory.events       # "high" counts MemoryHigh reclaim
systemctl show temporal-history -p MemoryCurrent -p MemoryHigh -p MemoryMax
And pprof, enabled via global.pprof.port in static config (keep it on localhost or a management network — it exposes internals):
# CPU: is the GC at the top?
go tool pprof -top "http://<history-host>:7936/debug/pprof/profile?seconds=30" | head -20
# Heap: who holds the memory?
go tool pprof -top -sample_index=inuse_space "http://<history-host>:7936/debug/pprof/heap" | head -20
# Goroutines: thousands of long polls show up here on Frontend/Matching
curl -s "http://<frontend-host>:7936/debug/pprof/goroutine?debug=1" | head -5
The SDK-side metrics that complement these are in the SDK metrics post.
What I'd tell myself before go-live
- PostgreSQL is the whole state. If it isn't committed, it didn't happen, and the shard count is baked into every primary key forever.
- One step = two commits = two WAL flushes, and capacity is planned in state transitions, not workflows. Disk flush time → commit time → slot held → queue → user latency. When
persistence_latencyrises with PostgreSQL CPU low, look atWALSyncwaits and the volume's IOPS before touching Temporal. - Give the outbox tables their own autovacuum settings on day one; the 20% default lets dead rows pile up exactly where the queue readers scan.
history_nodegrows until the cluster is older than retention. Lowering retention only affects future closes; deleting never shrinks the file;pg_repackoff-peak with free disk ≈ table size does. Keep payloads in object storage so it grows slower.- Visibility in its own database, ideally its own instance. Every close touches ~70 indexes.
- Cap History's cache to fit the node, in bytes, and restart to apply. 128,000 entries on 2 GiB cost us 3.6 cores of GC.
- Don't fix GC thrash with a bigger
GOMEMLIMIT. Keep it ≈ 2/3 ofMemoryHigh; high iowait means the limits are wrong, high CPU with low iowait means the GC. - Size for N-1. Per-shard caches double on the survivor; use host-level, byte-limited caches and prove it with a kill drill.
Next in the series: the metrics that matter, the triage tree, and capacity planning.