Temporal in Production: Failure Drills, a Reference Architecture, and the PostgreSQL Wall
On this page
- Paused, not lost
- Six drills
- The recovery burst, worked out
- Failure by failure
- Frontend, Matching, the internal worker
- An SDK worker
- The PostgreSQL primary
- Network partition
- The slow host: worse than a dead one
- Before you scale: is it real work?
- The layout I'd start with
- Three all-role hosts, for headroom
- One address, and an LB that respects long polls
- PostgreSQL gets its own machines
- Alerts: page on symptoms, warn on mechanisms
- Benchmark, then break it on purpose
- Migrating two clusters into one
- The persistence wall
- Name the axis before you scale
- Is Temporal decentralised? No.
- What I'd tell myself before go-live
TL;DR: Temporal fails paused, not lost. Every workflow step ends in one PostgreSQL transaction, so anything committed survives the death of any server process, and anything not committed is retried by whoever sent it. The real danger is around the failure. There's the recovery burst when everything that was waiting runs at once: a 20-minute database outage with 12,000 due timers is ~48,000 writes against a ~685 writes/s disk. There's the slow-but-alive host the membership ring never evicts, the full disk you can't delete your way out of, and the panicked human who terminates workflows that only needed a rollback. For layout, I'd start with 3 all-role Temporal hosts (for N+1 headroom, not quorum, since the ring has none), PostgreSQL on its own primary + standby from day one, one load-balanced Frontend address whose idle timeout outlasts a long poll, and alerts that page on symptoms and warn on mechanisms. Two clusters can't be merged; you drain workloads into one and re-join the empty server as a member. Above all of it sits one PostgreSQL primary, and no number of Temporal hosts makes it faster.
Every earlier post in this series looked at one part of the machine: Frontend, History, shards, Matching, the database, metrics, membership. This one covers what happens when those parts break, and how I'd lay the cluster out so that each break is boring.
Most Temporal incidents I've seen don't lose data. What they do have is an engineer at 3 a.m. restarting History hosts "to clear things", or doubling the worker fleet "to drain the backlog faster", which makes the incident longer either way. Before touching anything you want two answers: what is actually at risk, and what will make it worse. One idea answers both.
Paused, not lost
Every step of every workflow ends with one database transaction holding the new history events, the updated mutable-state row, and the tasks for what happens next (the transactional outbox from the History post). Either the whole step is in PostgreSQL or none of it is. No server process holds the only copy of anything committed. Three guarantees follow:
- Committed state is durable. History, timers and task-queue backlogs live in PostgreSQL.
- Ownership is fenced in the database. Workflow writes take the
shardsrowFOR SHAREand checkrange_id; acquiring a shard takes itFOR UPDATEand bumps it. A stale owner's writes fail withShardOwnershipLostError. Two hosts can briefly believe they own a shard, but only one can commit. - Execution is at-least-once. An activity whose completion was lost runs again after its timeout. Your activities must be idempotent.
The flip side matters more. While something is down, timers keep coming due, retries keep being scheduled, and work piles up. When the broken thing comes back, all of it arrives together.
Six drills
These are the six stories I make every on-call engineer able to tell from memory.
1. A History host dies.
host dies -> ring notices (seconds) -> its shards are reassigned to survivors
-> each new owner bumps range_id and loads the shard's queue bookmarks (ack levels)
-> tasks after the last saved bookmark run again (duplicates are dropped by state checks)
-> caches start cold: extra DB reads for a while
-> per-host rate limits now cover one fewer host
You'll see a few seconds of ShardOwnershipLost and a latency spike while numshards_gauge moves to the survivors. Check that the per-host counts add back up to numHistoryShards and that the survivors can carry the load. Don't restart a survivor in a panic, because that moves every shard again.
2. The database is down or fails over. History can't save anything, every request fails, and clients and workers retry with backoff. Nothing moves and nothing committed is lost. When PostgreSQL returns, the recovery burst starts (next section).
3. The disk fills. PostgreSQL can't write WAL and may shut down. It looks like drill 2 but is worse, because cleanup needs free disk: retention deletes are writes, and pg_repack needs roughly a table's size of free space. Alert at 70% and 80%, track growth per day, and in an emergency expand the disk first.
4. A bad worker deploy. New code replays differently than the recorded history, so the workflow task fails with [TMPRL1100] Nondeterminism error and keeps retrying. The workflows sit in Running, not failed. Roll back the worker and they resume on their own, then redo the change with patched() and a replay test (determinism post). When a teammate wants to terminate and restart 5,000 stuck workflows, the answer is no: every step re-runs from the beginning, and the emails and charges that already happened happen twice.
5. All workers are down. With no pollers, tasks pile up in the backlog, and activities time out and add their retries to the pile. When workers come back, that backlog lands on your downstream APIs. Bring workers back gradually, and throttle them with maxConcurrentActivityTaskExecutions or maxActivitiesPerSecond.
6. The whole cluster is down. This is the only drill where the application sees errors, because "start workflow" fails. The API that starts workflows must retry, buffer, or tell the user to try again.
| Failure | Lost? | Main danger |
|---|---|---|
| History host dies | No | Survivors not sized for N−1 |
| DB down or failover | No (committed data) | Recovery burst |
| Disk full | No, but stuck | Can't fix it by deleting |
| Bad deploy (NDE) | No | Panicked terminations |
| Workers down | No | Backlog burst hits downstream |
| Cluster down | Starts fail | The app must handle it |
The recovery burst, worked out
Here's the arithmetic. PostgreSQL was down for 20 minutes and 12,000 timers came due. Each due timer becomes "timer fired" plus a new workflow task, the worker replies, and the reply is persisted. Call it roughly 4 writes per timer. That's an estimate; the real count depends on what each workflow does next.
12,000 timers x 4 writes ≈ 48,000 writes      disk ceiling on that cluster: ~685 writes/s

best case, whole disk free:            48,000 / 685 ≈ 70 s at 100% disk
normal traffic 300/s, spare 385/s:     48,000 / 385 ≈ 2 min
at peak 600/s (88% busy), spare ~85/s: 48,000 / 85  ≈ 9-10 min
The background loads are illustrative. The burst sits on top of normal traffic, so at peak a 20-minute outage can mean ten more minutes of degraded service.
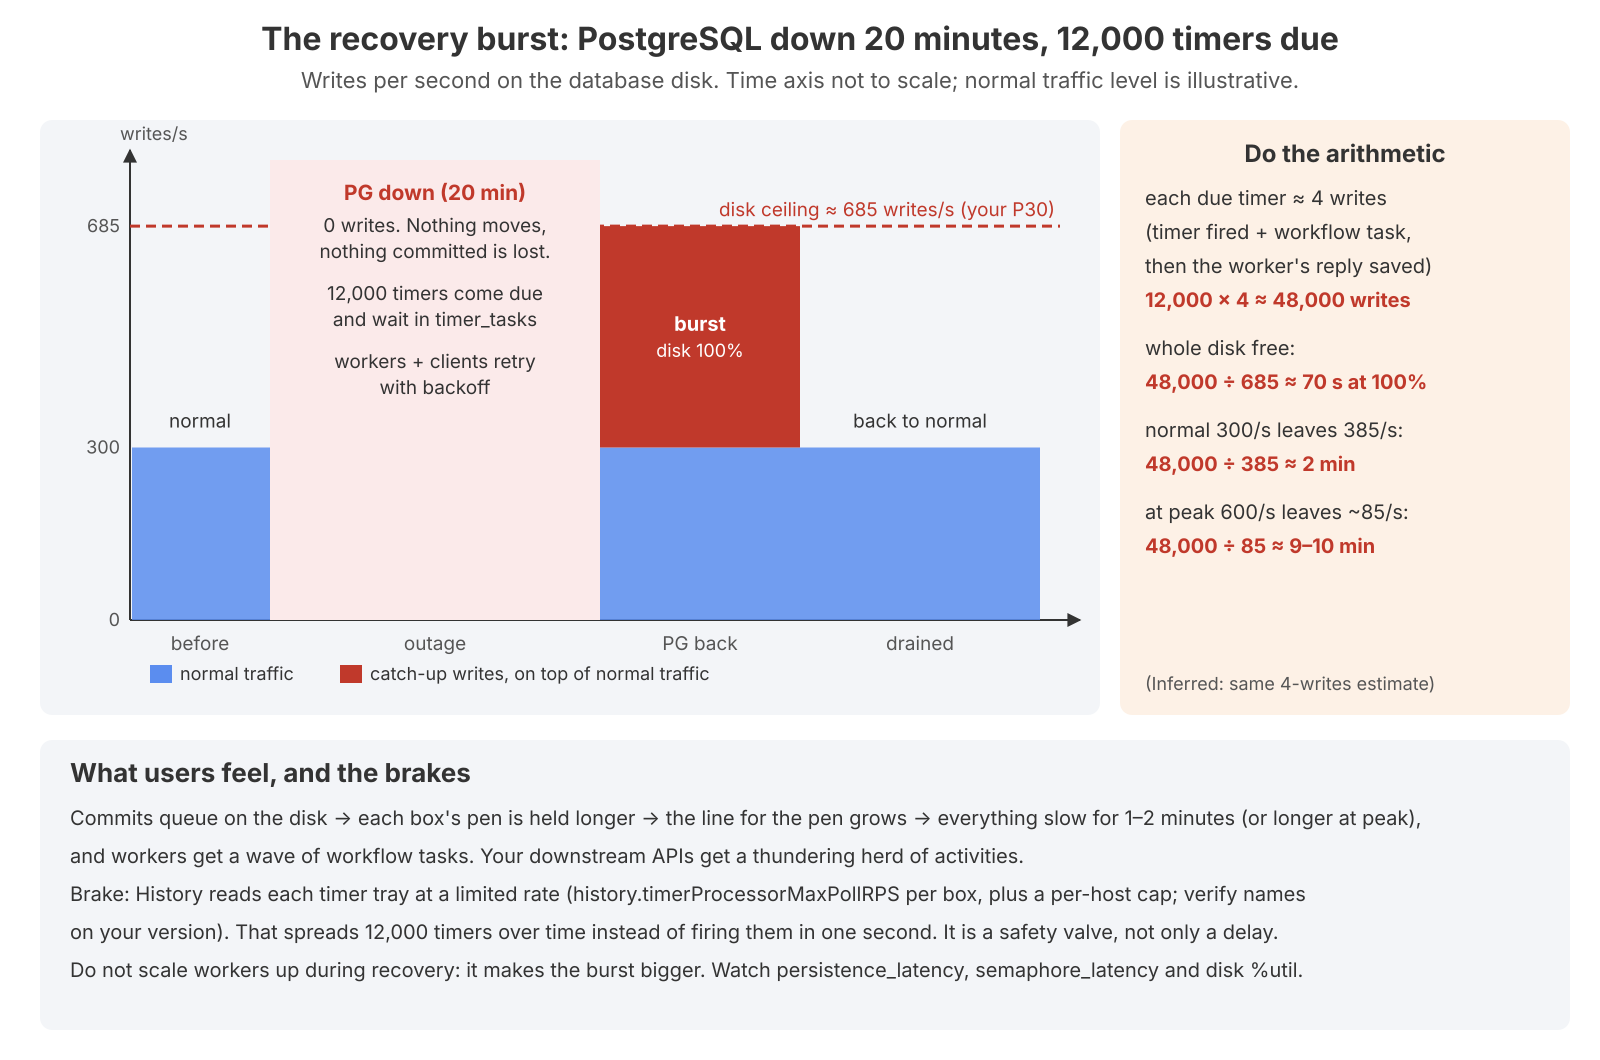
What users feel: commits queue on the disk, each shard's IO semaphore is held longer, the queue for it grows, everything is slow, and workers get a flood of workflow tasks. In metrics, persistence_latency rises next to semaphore_latency.
Temporal has brakes for this. History reads each shard's timer queue at a limited rate (history.timerProcessorMaxPollRPS per shard, plus the per-host history.timerProcessorMaxPollHostRPS; names move between versions). *.persistenceMaxQPS caps how hard each service hits the database. These are safety valves, not just delay. People make the burst bigger three ways: scaling workers up (more pollers pulling work into the same saturated disk), restarting History (shard reloads and cold caches on top), and raising rate limits (removing the brakes). Let it drain. If downstream is suffering, lower worker slots.
Failure by failure
When I'm on call, I ask the same things of each failure: what breaks, what moves, what's at risk, which metrics change, and what I must verify.
Frontend, Matching, the internal worker
These are the easy ones. Frontend owns nothing, so the LB drops it and SDKs reconnect. A start that committed but lost its response is safe to retry (workflow ID uniqueness), and a lost poll response times out and is redelivered. Check that the survivors aren't now throttled by per-host limits (resource_exhausted_cause="RpsLimit"). Matching partitions move to a new owner, which bumps range_id in task_queues and reloads the backlog from tasks. A task that was mid-handover was never acknowledged, so History retries it. Expect under a minute of schedule-to-start spike. The internal worker runs Temporal's system workflows (Schedules, batch, namespace deletion, scavengers), not yours, and retention deletion is a History timer task, so it keeps working. Run two internal workers, because schedule actions missed beyond their catch-up window are skipped.
For a dead History host, also verify sum(numshards_gauge) == numHistoryShards, that the queue lag has drained, and that survivor memory is OK. Anything sized per shard just grew (ring mechanics).
An SDK worker
Temporal learns a worker is dead only through timeouts: workflow task start-to-close (default 10 s), sticky schedule-to-start (5 s in Go, roughly 5–10 s by SDK), and the activity's heartbeat or start-to-close timeout. That last one is where hours disappear. Take an export activity with a 2-hour start-to-close and no heartbeat timeout. If its worker crashes at minute 1, the retry starts two hours later. With a 30 s heartbeat timeout and heartbeat() every ~10 s, the crash is detected in ~30 s, and the retry can resume from the heartbeat details. Every activity longer than a few seconds should heartbeat. Shut workers down gracefully, not with SIGKILL, so they release their sticky queues straight away.
The PostgreSQL primary
This is the dangerous one.
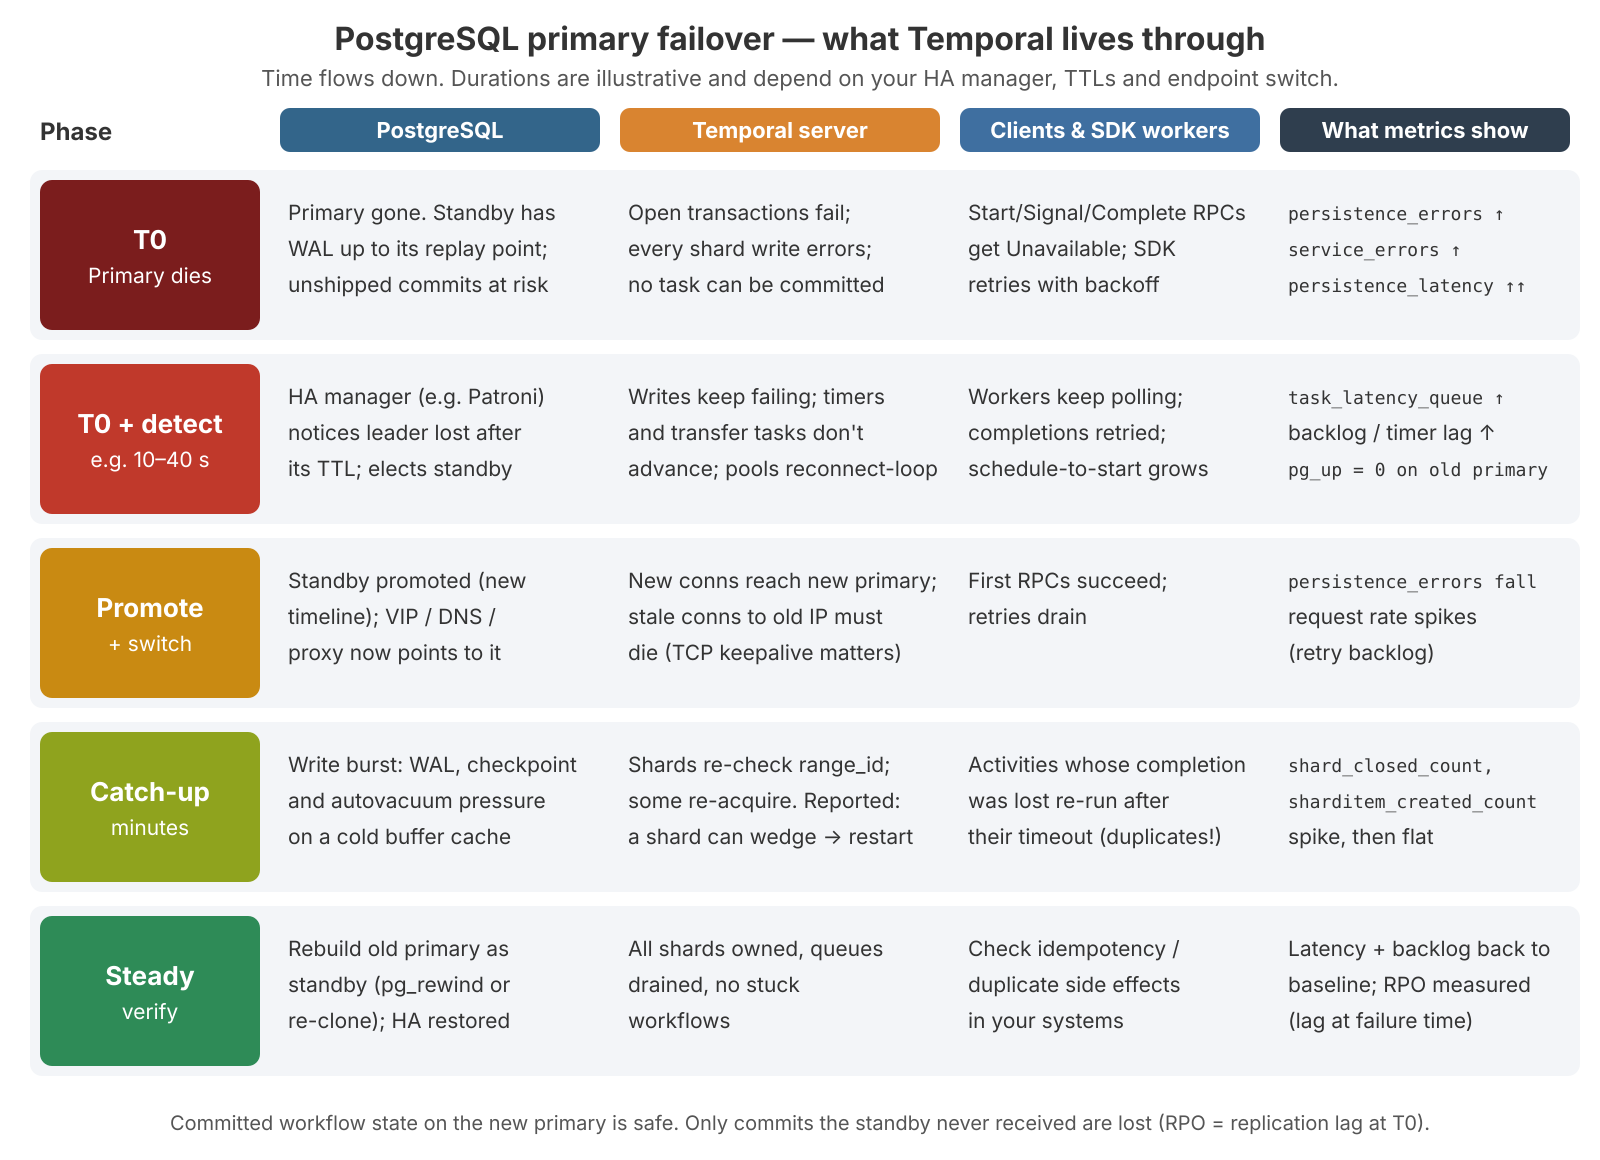
Every write in the cluster stops until a new primary accepts connections. What's at risk depends on the replication mode. Synchronous loses nothing committed (RPO 0). Asynchronous loses commits the standby hadn't replayed, so the RPO is the replication lag at the moment of failure. For Temporal that means progress it already acknowledged can vanish: a client was told "started" for a workflow that no longer exists, an activity completion disappears and the activity runs again, a signal is lost. Temporal can't detect any of it, because to Temporal the database simply went back in time.
There's one more runbook item. A public upstream issue, temporalio/temporal#12246, still open as I write this, reports that after a clean ~30 s Patroni failover one History shard stopped making progress indefinitely. Its timers never fired, and the deadlock detector kept logging potential deadlock detected for Shard(N)-io-semaphore (v1.32 also emits dd_current_suspected_deadlocks; alert on it). Only restarting History fixed it. It's a single report, not a confirmed general defect, but until you've proven your version is unaffected, check for a frozen shard after every failover:
-- overdue timers concentrated on one shard = a frozen shard
SELECT shard_id, min(visibility_timestamp) AS oldest_due, count(*)
FROM timer_tasks WHERE visibility_timestamp < now()
GROUP BY 1 ORDER BY 2 LIMIT 10;journalctl -u temporal-history --since "30 min ago" | grep -E "potential deadlock detected|io-semaphore"If one shard is stuck, rolling-restart History. Design choices that change this failure:
synchronous_commit = on+synchronous_standby_namesgives RPO 0 at the cost of a round trip on every commit. Measure it.- With exactly one synchronous standby, losing that standby blocks all commits, and Temporal sees a full outage while the primary is fine. Use
ANY 1 (s1, s2), or let Patroni downgrade (synchronous_mode_strict: false). - Switch with a VIP or proxy, not long-TTL DNS. Keep
maxConnLifetimeshort and TCP keepalives on, so connections to the old IP die quickly. - An inactive replication slot retains WAL on the primary, which is drill 3 in slow motion. Watch
pg_replication_slots.
Network partition
Each side's ring sees the other as dead and tries to take the "missing" shards. If both sides can reach PostgreSQL, they fight, and you get ownership churn and low throughput, but never corruption:
A -> PG: take shard 7 (range_id 41 -> 42)        ok
B -> PG: take shard 7 (range_id 42 -> 43)        ok
A -> PG: update workflow (expects range_id 42)   rejected: ShardOwnershipLost
membership_changed_count and shard_closed_count keep rising, and summed numshards_gauge can exceed numHistoryShards (two views of the ring). Compare tdbg membership list-gossip from both sides. Never stretch one cluster across a WAN, and stop a flapping host rather than letting it bounce in and out of the ring.
The slow host: worse than a dead one
A host that's alive but very slow (CPU steal, GC, a sick disk) still answers gossip heartbeats, which are cheap. So Temporal never moves its shards. About 1/N of workflows are slow, clients retry onto the same host, and the cluster average looks only mildly worse. You catch it only per instance:
histogram_quantile(0.99,
  sum by (le, instance) (rate(service_latency_bucket{service_name="history"}[5m])))
Alert when one instance's p99 is a multiple of its peers' median, with the factor taken from your benchmark. The fix is to stop the process so its shards move to healthy hosts, then investigate the machine.
Before you scale: is it real work?
The other incident reflex is "it's at 90%, add one". I ask four questions first. Is it real work, meaning state transitions/s rose along with CPU, rather than retries, rejections and idle polls? Is it the role or one host (by (instance) on everything)? What's downstream of what I'd add? What does the fix cost, and where? Then I say one sentence out loud: "X is the bottleneck because… Adding Y won't help because… I'll change A, which pressures B, so I verify C first." The CPU numbers below are illustrative, because Temporal publishes no CPU threshold for scaling.
| Symptom | Usually | Do |
|---|---|---|
| Frontend 90%, rest idle | Retry storm on RpsLimit, too many pollers, visibility queries in a loop, LB cutting long polls | Fix the waste. If the load is real, add Frontends and re-derive per-host limits |
| History 95%, PostgreSQL 45% | GC at GOMEMLIMIT, cache thrash, huge histories, a hot shard | Remove the waste; check commit latency and connections; add one host at a time |
| Matching hot on one host | A hot queue's partitions live there; a falling sync-match ratio means you're short of workers | More partitions for that queue, or more workers |
| PostgreSQL 95%, Temporal idle | Every role waiting on commits | Cut writes, grow the primary, lower history.persistenceGlobalMaxQPS. Don't add hosts |
| One History host hot | Ring imbalance, one hot workflow ID (lock_latency, BusyWorkflow), noisy-neighbour VM | One workflow ID maps to one shard: more hosts move it, never split it |
| Schedule-to-start 30 s, servers idle | Worker slots at 0, too few pollers, wrong queue name | Worker capacity, not server capacity |
| Persistence spikes nightly at 02:00 | Backups, autovacuum, checkpoints, a retention delete wave | Move or throttle that job |
Two notes. First, scaling workers from 20 to 200 with the same poller settings means 10× the long polls. That exceeds frontend.namespaceCount (default 1200 per host per namespace) and shows up as ConcurrentLimit. Second, a latency stuck at an exact number is a limit, not load. I once chased a flat ~4.9 s schedule-to-start on every queue. The cause was history.transferProcessorMaxPollHostRPS at 120, shared by 512 shards, so each shard was read every ~4.3 s. Current source defaults it to 0 (off), so check your own config.
The layout I'd start with
Three all-role hosts, for headroom
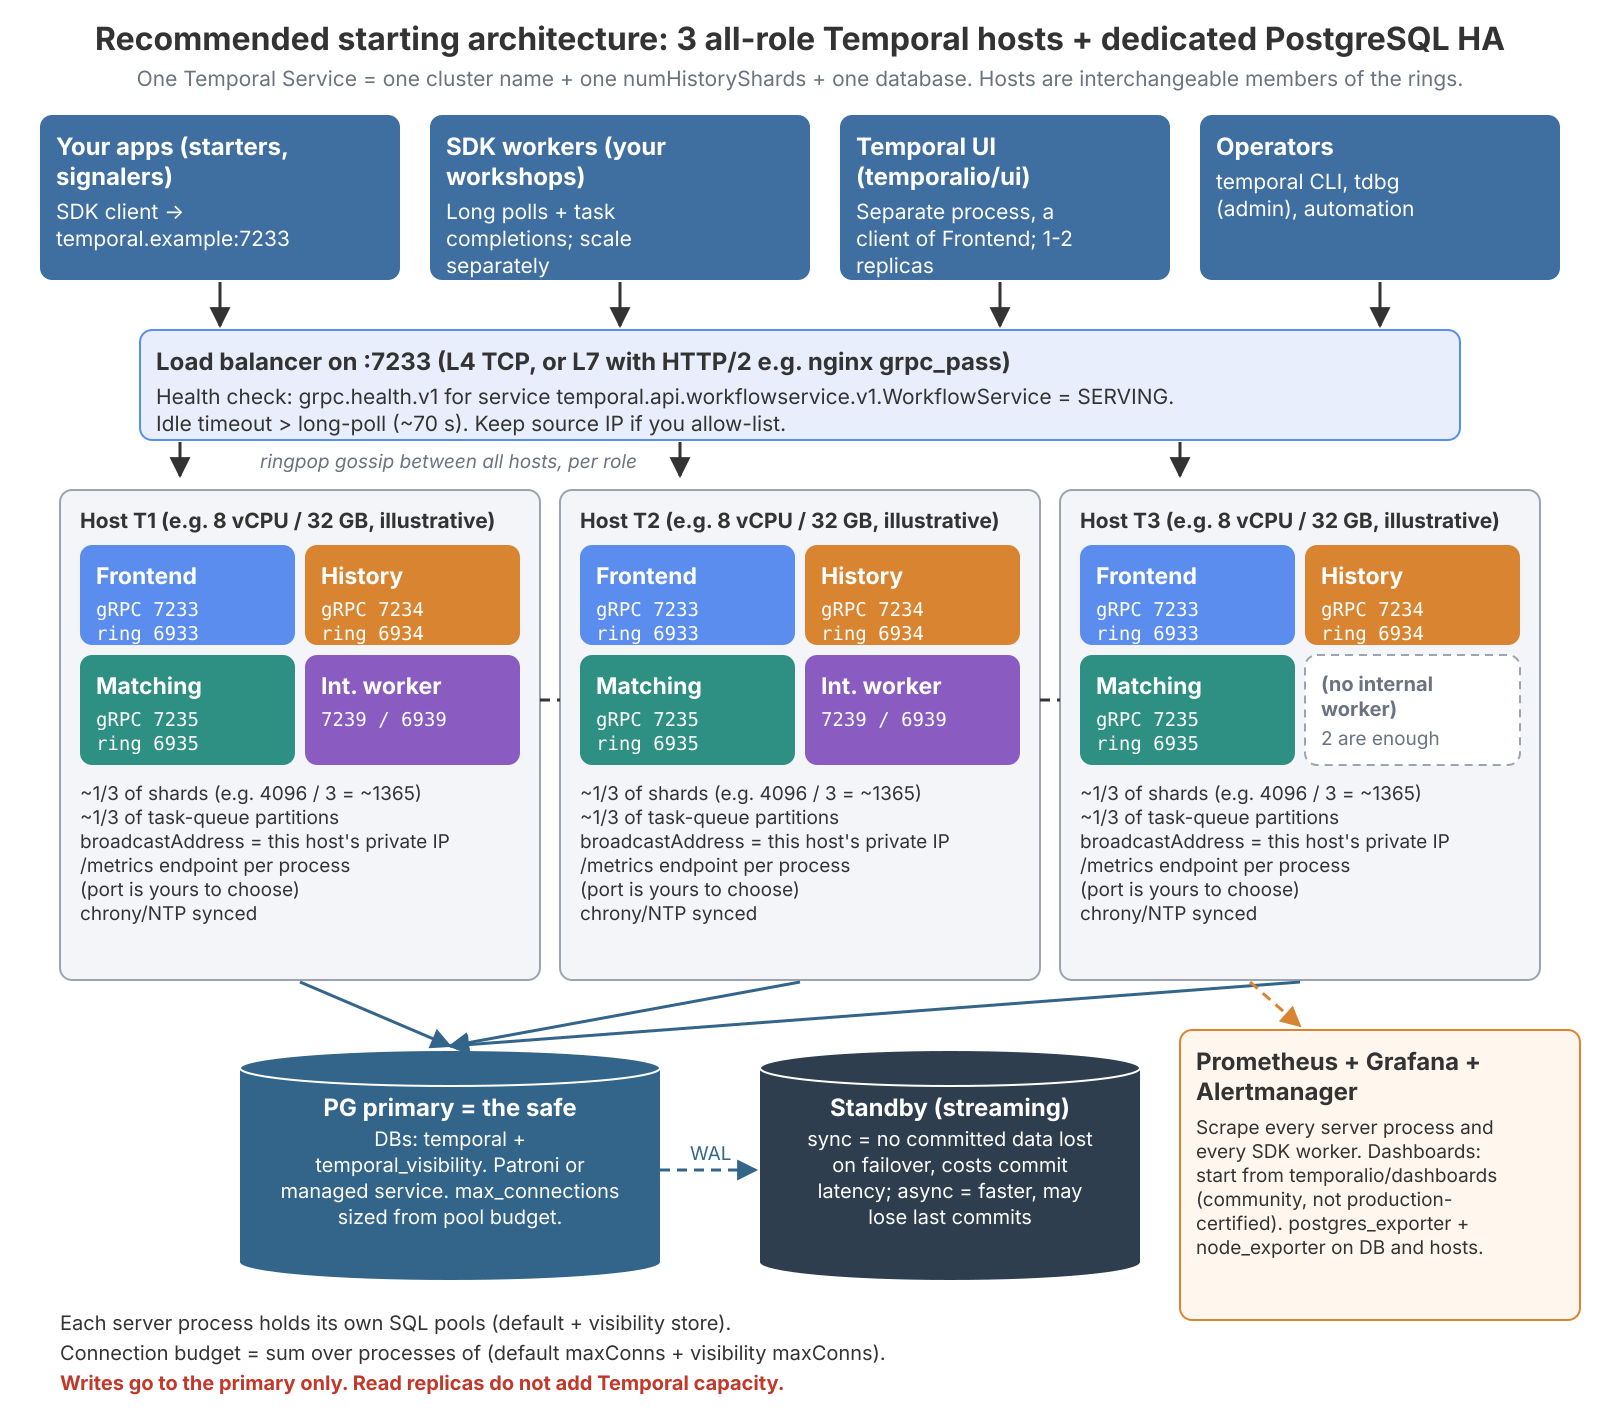
Temporal's ring (ringpop) has no quorum. A one-host ring is still valid, and correctness comes from range_id fencing in the database. "Three for quorum" applies to etcd or Patroni, not Temporal. The reason for three is N+1 arithmetic:
target per host ≈ (N − 1) / N × your saturation knee − margin for the cold-cache spike
N = 2:  50%  → ≈ 45%          N = 3:  66%  → ≈ 60%
With two hosts, the survivor of a failure takes 2× load. It saturates exactly when it inherits half the shards with cold caches, and a rolling restart leaves one host carrying everything. The N−1 rule applies to more than CPU. Two Frontends at namespaceRPS 2400 admit 4,800/s until one dies, and then yesterday's traffic gets RPS_LIMIT. A per-shard cache doubles on the survivor at the moment its work doubles. Anything sized per host or per shard has to work on the day one host is gone.
Run all roles on every host at first. You don't know yet which role saturates first, and splitting later is only process placement. Put the internal worker on two hosts, and keep your SDK workers off the Temporal hosts, because during a backlog drain workers and History peak together. 8 vCPU / 32 GB per host is a reasonable first guess for 4096 shards, but the docs' starting ratio of 1 History process per 500 shards would suggest ~8 History processes there. Start at 3 only after a benchmark shows ~1365 shards per process is healthy.
Only a few things differ between hosts; everything else must be identical:
global:
  membership:
    broadcastAddress: "<this host's private IPv4>"   # never 127.0.0.1 in a multi-host ring
services:
  frontend: { rpc: { grpcPort: 7233, membershipPort: 6933, bindOnIP: "<this host's IP>" } }
  history:  { rpc: { grpcPort: 7234, membershipPort: 6934, bindOnIP: "<this host's IP>" } }
  matching: { rpc: { grpcPort: 7235, membershipPort: 6935, bindOnIP: "<this host's IP>" } }
  worker:   { rpc: { grpcPort: 7239, membershipPort: 6939, bindOnIP: "<this host's IP>" } }
One address, and an LB that respects long polls
SDK clients hold long-lived HTTP/2 connections, so DNS round-robin pins each one to whatever IP it resolved at startup. Use an LB. L4 balances per connection, which is fine with many clients. L7 balances per request, but its timeouts have to outlast a long poll:
upstream temporal_frontend {
    server t1:7233 max_fails=3 fail_timeout=10s;
    server t2:7233 max_fails=3 fail_timeout=10s;
    server t3:7233 max_fails=3 fail_timeout=10s;
}
server {
    listen 7233 http2;
    location / {
        grpc_pass grpc://temporal_frontend;
        grpc_read_timeout 120s;   # > ~70 s SDK long-poll timeout
        grpc_send_timeout 120s;
    }
}
The server holds a poll for matching.longPollExpirationInterval (~1 min), and SDKs time out at ~70 s. A 60 s idle timeout on any hop therefore produces constant Unavailable errors on polls, so I keep every hop at 2 minutes or more. Health-check the gRPC health service (grpc_health_probe -service=temporal.api.workflowservice.v1.WorkflowService), not just the port, and set frontend.shutdownDrainDuration longer than one long poll. The same lesson applies to workers. I once traced 70-second heartbeat stalls to pm2 sending SIGKILL after 5 s with no shutdownGraceTime on the worker. Set shutdownGraceTime shorter than pm2's kill_timeout.
PostgreSQL gets its own machines
disk speed → commit time (fsync) → time each shard's semaphore is held → queue → user latency| Decision | Choice |
|---|---|
| Dedicated machine | From day one. A co-located DB fights History for CPU and disk |
| Standby | Sync if losing the last commits is unacceptable, async if commit latency matters more. Measure both |
| Visibility | Its own temporal_visibility database; its own instance once list queries compete |
| Read replicas for Temporal | No value: Temporal reads what it just wrote, from the primary |
| PgBouncer | Only after verifying your exact Temporal version and testing it under load, including a failover |
| Connections | max_connections ≥ sum over processes of (default + visibility maxConns) + headroom. Then count with pg_stat_activity |
| Disk | Pick the IOPS/latency class first |
That last row came from a real cluster. Its narrowest point was a ~685 ops/s managed disk at 88% busy, not the CPU and not the shard semaphores. (Database internals are in the persistence post.)
Alerts: page on symptoms, warn on mechanisms
Scrape every server process, every SDK worker, node_exporter, postgres_exporter and the LB. SDK metrics are the only place you'll see schedule-to-start as the worker experiences it (collecting them from many workers). Page only when users are hurt now or progress has stopped. Warn when a mechanism drifts, so the warning explains a page rather than causing one. Temporal publishes no alert thresholds, so these are starting points for your benchmark to replace:
- alert: TemporalFrontendErrorRatioHigh      # symptom: users hurt
  expr: |
    sum(rate(service_errors{service_name="frontend"}[5m]))
      / sum(rate(service_requests{service_name="frontend"}[5m])) > 0.01
  for: 10m
  labels: { severity: page }
- alert: TemporalPersistenceErrors           # symptom: progress stopped
  expr: sum by (operation) (rate(persistence_errors[5m])) > 0.5
  for: 5m
  labels: { severity: page }
- alert: TemporalResourceExhausted           # SDKs retry quietly: users see slowness, not errors
  expr: sum by (resource_exhausted_cause) (rate(service_errors_resource_exhausted[5m])) > 1
  for: 10m
  labels: { severity: warning }
- alert: TemporalPersistenceLatencyHigh      # p99 > 100 ms
  expr: |
    histogram_quantile(0.99, sum by (le, operation)
      (rate(persistence_latency_bucket{service_name="history"}[5m]))) > 0.1
  for: 10m
  labels: { severity: warning }
- alert: TemporalShardChurn                  # outside deploys = membership instability
  expr: sum(increase(sharditem_created_count[15m])) > 0 unless on() (deploy_in_progress == 1)
  for: 15m
  labels: { severity: warning }
I also page on up == 0. I warn on History task_latency_queue p95 over 5 s, a sync-match ratio under 0.8, SDK schedule-to-start p99 over 1 s, worker slots at 0, PostgreSQL connections over 80%, and replication lag over 10 s. Database disk gets a warning at 70% and a page at 80%. Label names vary by version, and deploy_in_progress is a placeholder for your own deploy annotation. Slow persistence is only a warning because a slow database may not be hurting users yet, and paging on it trains people to ignore pages.
Benchmark, then break it on purpose
Benchmark the real topology in staging at the production shard count with temporalio/omes, raising the rate step by step (capacity post). The knee is where latency stops being flat. With wait ≈ service × busy / (1 − busy), 80% busy means ~4× the work and 97% means ~32×. Plan peak at 60–70% of the smallest ceiling, after removing one node. Then run the failure tests under load, writing down the expected result before each one:
| Test | How | Expect / verify |
|---|---|---|
| Kill a Frontend / History / Matching | kill the process | LB drops it; ~1/3 of shards re-acquired, then sharditem_created_count flat; schedule-to-start spike under a minute |
| PG failover | patronictl switchover, then kill the primary | Errors for the window, retries drain. No wedged shard. Measure RPO, watch the burst |
| Partition | iptables DROP between one host and the others, PG reachable | ShardOwnershipLost on that host only; no corruption |
| Slow host | tc qdisc ... netem delay 200ms or stress-ng | Keeps its shards. Does the outlier alert fire? |
| Disk full | fill the WAL volume, staging only | Disk alerts fire before it fills |
| Rolling deploy | one host at a time | Shard churn back to zero between hosts |
The slow-host test is the one that hurts in real life. Make sure the runbook has an explicit "stop the sick host" step.
Migrating two clusters into one
The next request is usually "make our two clusters one". Dumping one database into the other can never work. A Temporal Service is one store + one numHistoryShards + one cluster name, and the last two are immutable. A workflow's shard is farm.Fingerprint32(namespaceID + "_" + workflowID) % numHistoryShards + 1. Its rows are keyed by that shard ID, and its task IDs come from that shard's range_id blocks. No tool re-hashes all of that, and hand-written SQL would corrupt both clusters.
So you move workloads, not data. New work goes to the survivor, the other cluster finishes what it holds, you retire it, and its server re-joins as a member.
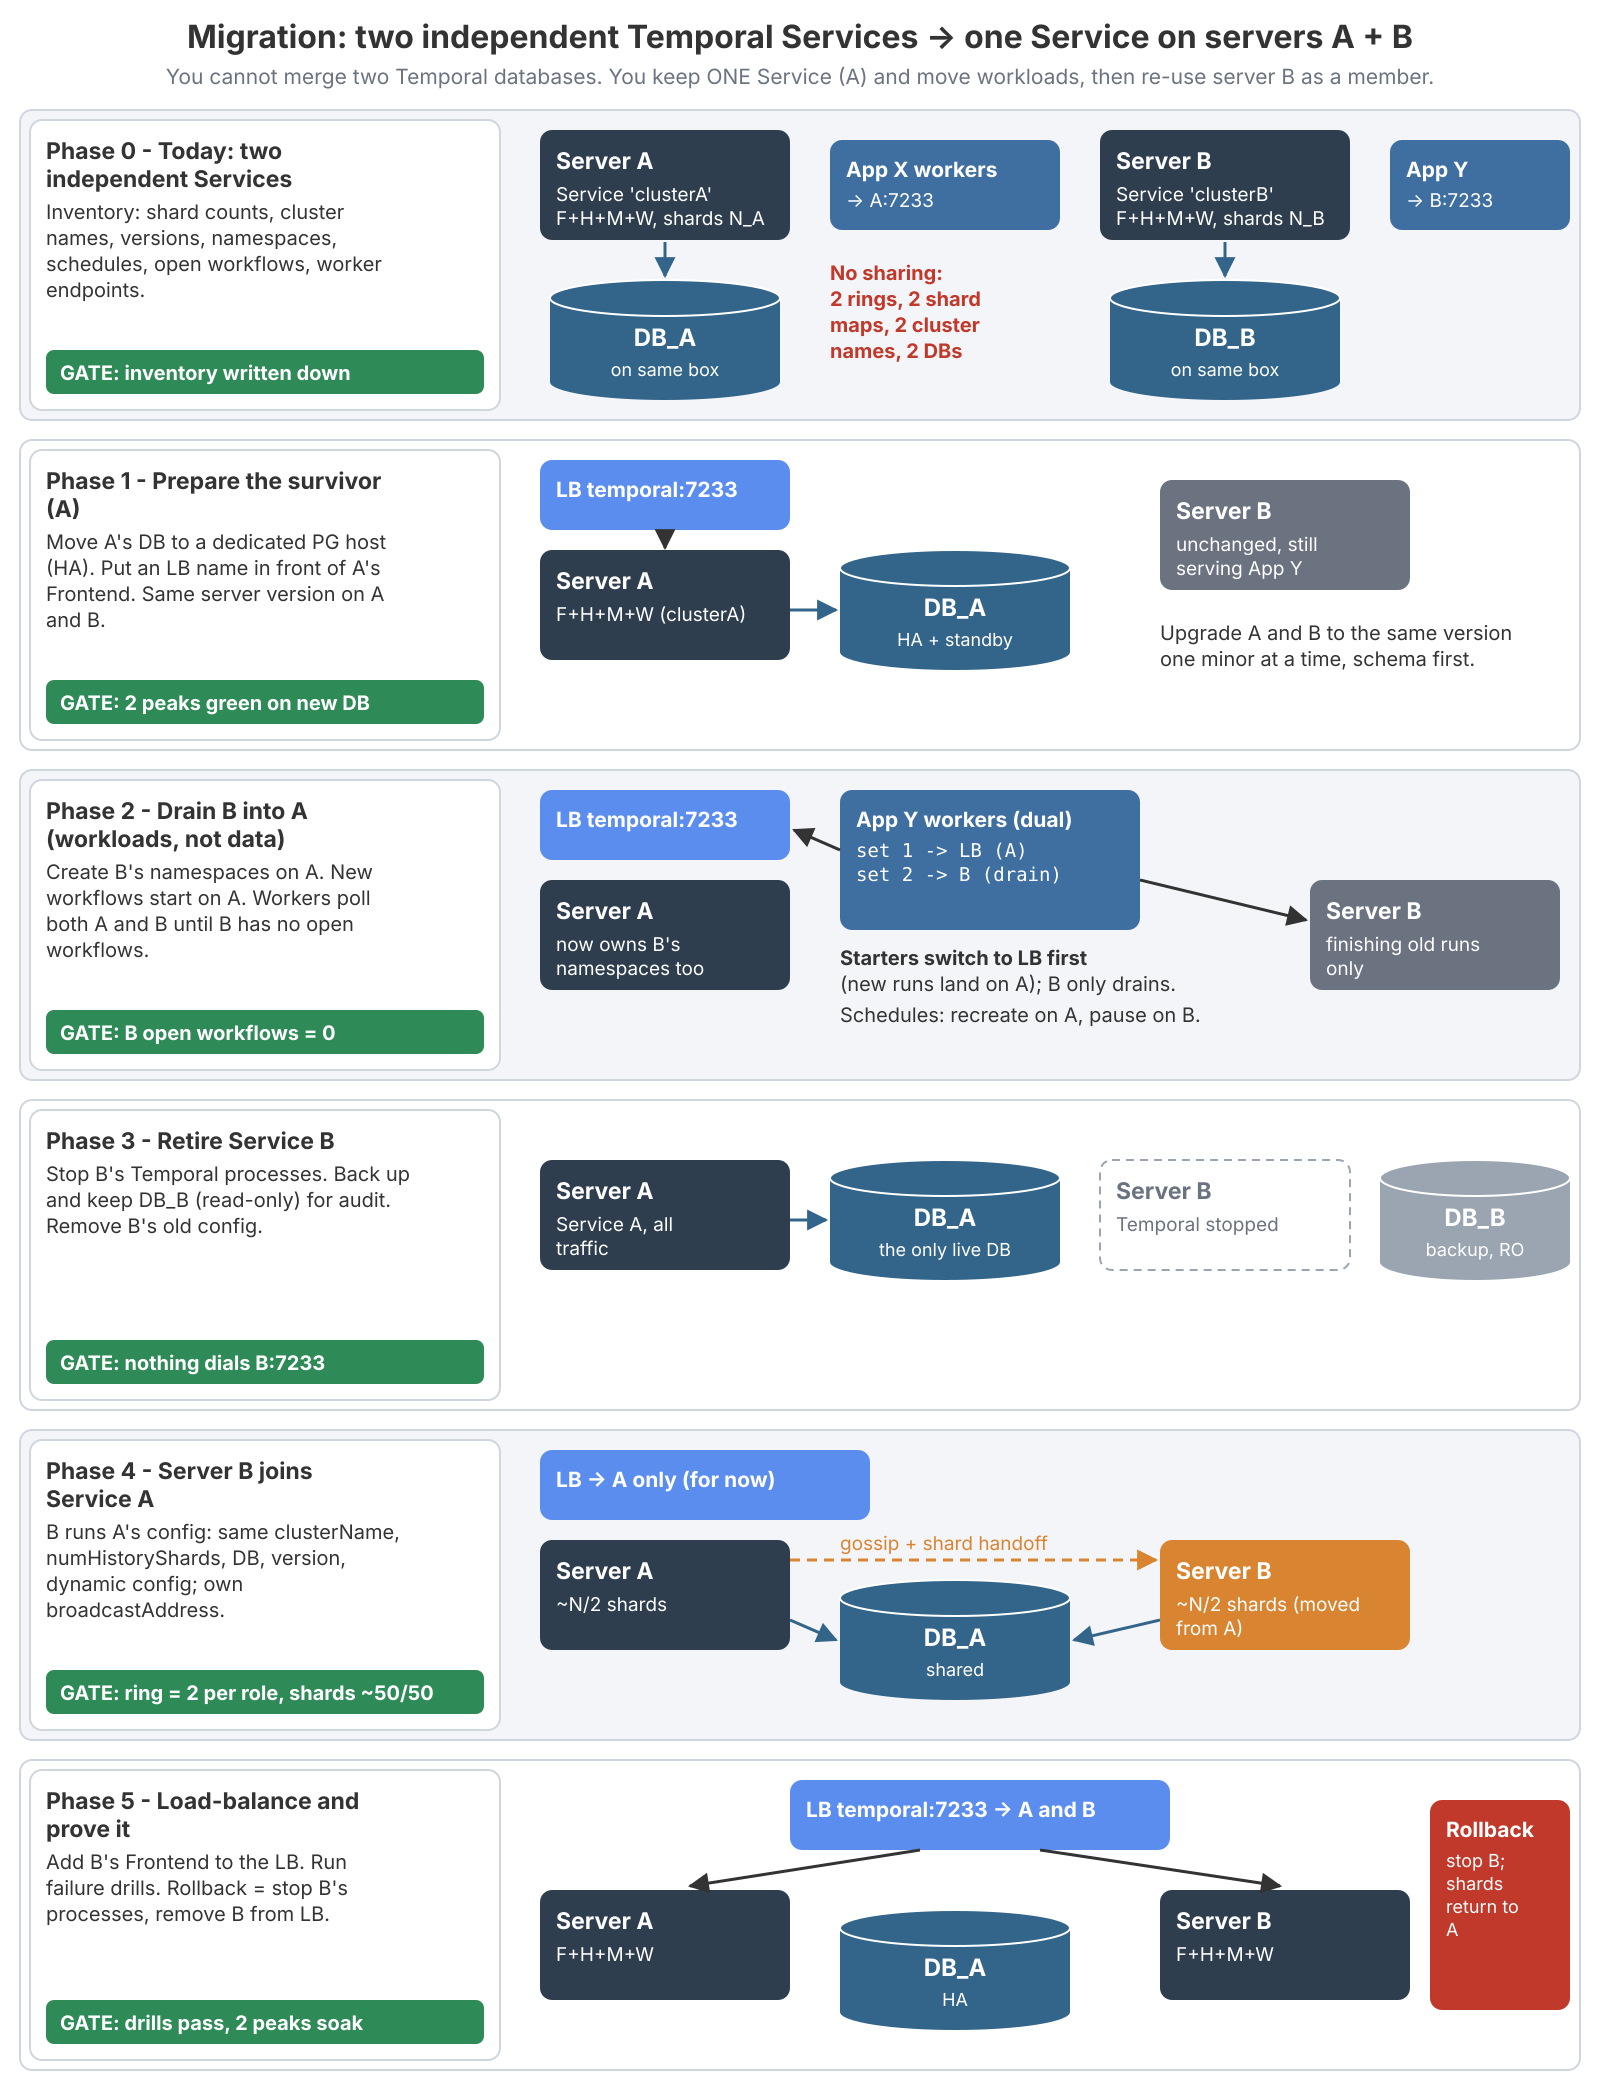
Pick the survivor by what can't change later. First its shard count, which you live with forever; if neither cluster's is right, build a third and drain both into it. Then whose database moves most easily to dedicated HA, the newer version, and the fewer long-running workflows. Draining is the default path. Multi-cluster replication suits workflows that live for months, but it's experimental in OSS.
- Inventory and freeze. For both clusters, record version, shard count (
temporal operator cluster describe), cluster name, namespaces with retention and search attributes, schedules, open workflows and their ages, and every client and worker that dials each one. - Prepare the survivor. Move its database to dedicated PostgreSQL HA first. Once two servers share a database living on one server's disk, that server can never die. Size
max_connectionsandpg_hbafor both hosts. Put an LB name in front of its Frontend now, even with one backend, so adding the second server later is a backend change. Align versions one minor at a time, schema first. Gate: two peaks at baseline persistence latency. - Drain. Recreate the namespaces and search attributes. Deploy workers polling both clusters first, then switch starters to the LB. Route signals for old workflows to the old cluster, because a signal to the survivor returns NotFound, or, with signal-with-start, creates a duplicate. That's the step teams forget. Recreate schedules paused, then pause the old ones and unpause the new ones in one step. Gate: zero open workflows and zero starts on the old cluster.
- Retire. Stop it, keep a read-only backup of its database for audit, and delete its old config, which would otherwise be a trap on the next reboot. Gate: nothing dials the old address for a full business cycle.
- Join. Copy the survivor's config exactly, with only
broadcastAddressandbindOnIPdiffering, and open all gRPC and membership ports both ways. On start, the server writes tocluster_membership, gossips, and takes about half the shards, each with arange_idbump and a brief write pause. Gate: two members per role, shards ~50/50, churn back to zero. - Load-balance and drill. Add its Frontend to the LB, run the failure tests, soak two peaks. Only then drop the old database.
Rolling back a member is cheap: stop its processes and its shards return, with nothing lost because every committed write is in the shared database. Rolling back a Service is a workload operation. That asymmetry is why the runbook has this shape. While it runs, change nothing else: no shard count, cluster name, version, retention, dynamic config, task queue names or worker code. The failures I'd expect are a new member owning no shards (broadcastAddress set to 127.0.0.1, or blocked membership ports), too many clients (connection budget not doubled), duplicate workflows (schedules active on both sides), and RPS_LIMIT with unchanged traffic (per-host limits now count twice).
The persistence wall
Everything above scales the server, and the server usually isn't the ceiling. One PostgreSQL primary is. Every task, completion, timer and signal ends in a commit on that primary. More History hosts all queue at the same door, and each one holds its shard's semaphore while it waits.
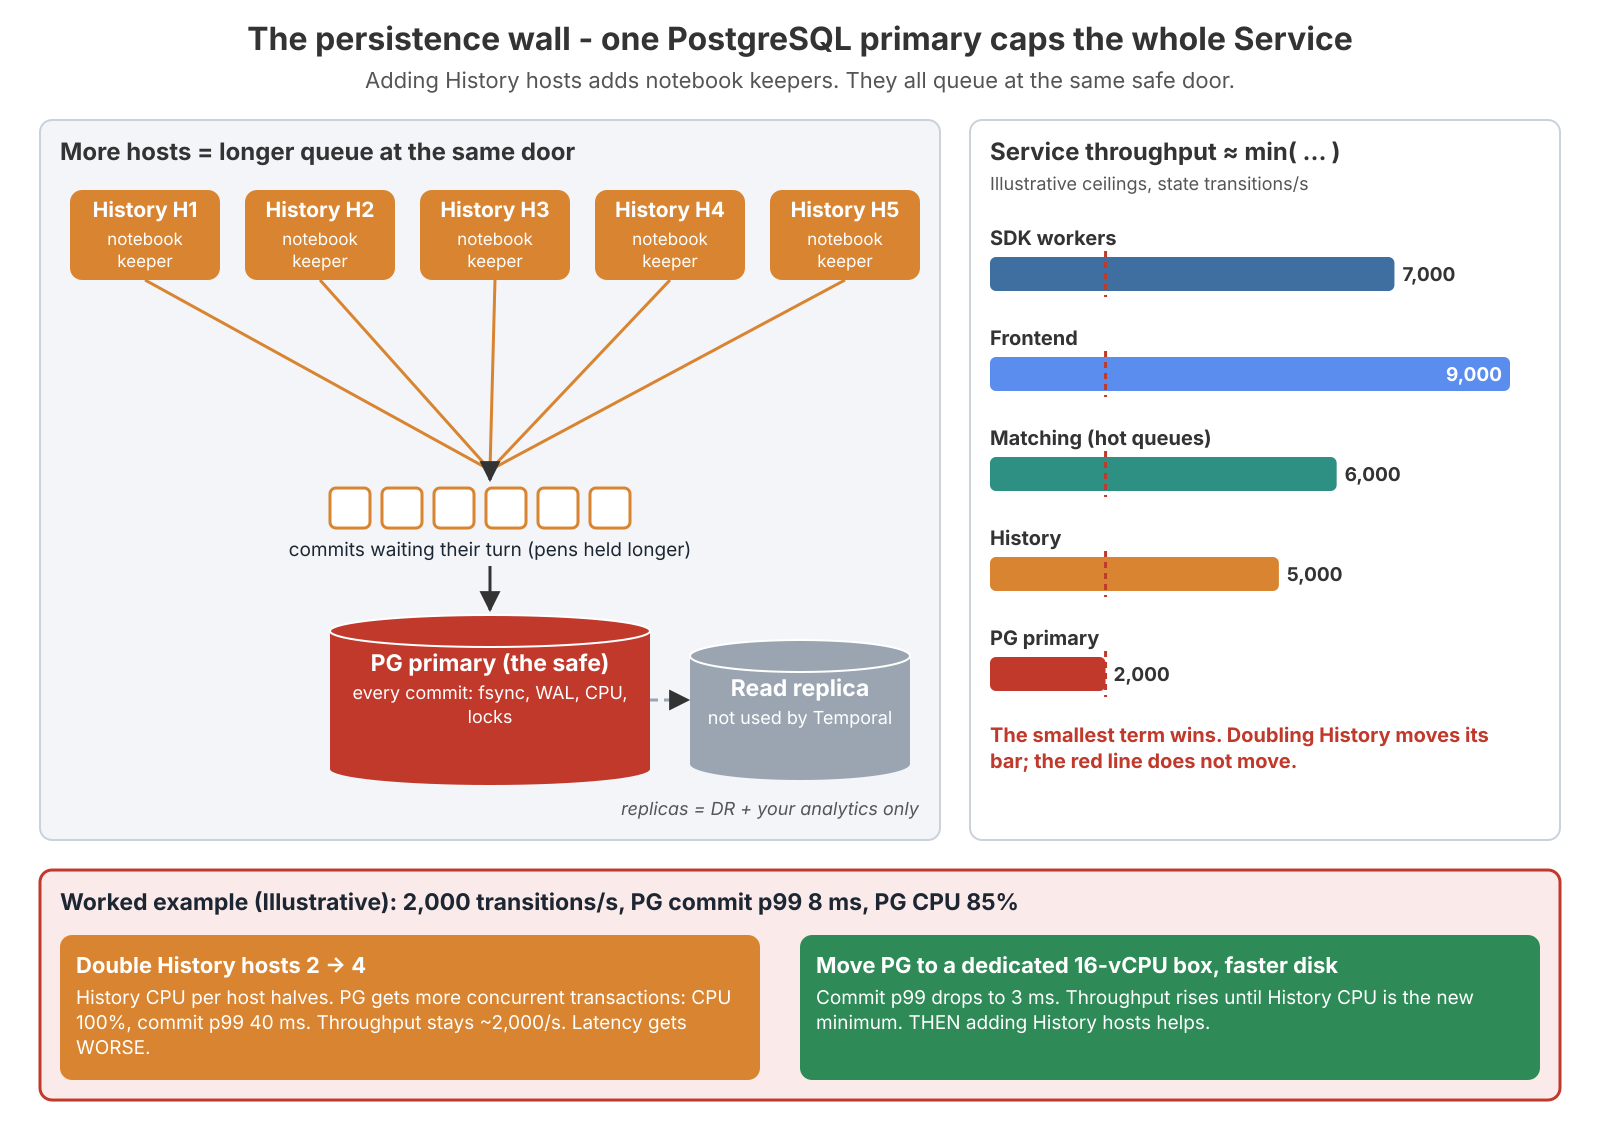
Service throughput ≈ min(
    PG primary write ceiling    ← commit latency, fsync/IOPS, CPU, WAL rate, locks
  , History capacity            ← hosts × CPU, bounded by shards and shardIOConcurrency
  , Matching for hot queues     ← partitions per queue
  , Frontend capacity           ← replicas × per-host limits
  , SDK worker capacity         ← slots, pollers, CPU
)
That's a mental model, not a formula, and its terms interact: raising shardIOConcurrency raises History's term and lowers the database's headroom. Horizontal scaling raises the middle terms and does nothing for the first. Read replicas don't help either. An illustrative case: 2,000 transitions/s, commit p99 8 ms, database CPU at 85%. Doubling History from 2 to 4 hosts pushes the database to 100% and commit p99 to 40 ms, and throughput stays at ~2,000/s. Moving PostgreSQL to a dedicated 16-vCPU box with a faster disk drops commit p99 to 3 ms, and then more History hosts help.
The wall often shows up as a semaphore queue before it shows up as slow queries. A teammate once argued "Postgres latency is only 10 ms, so the DB isn't the problem". But every commit waits on fsync, and it does so while holding the shard's semaphore. At 97% busy, that 10 ms commit became 1.4 s of waiting. Watch semaphore_latency p95 next to persistence_latency p99. If persistence latency rises on all operations and all hosts at once while Temporal CPU sits low, stop scaling Temporal.
Name the axis before you scale
| Axis | What you change | What it buys | Reversible? |
|---|---|---|---|
| 1. Shards | numHistoryShards | More units to spread across hosts | No: new Service + migration |
| 2. Per-shard concurrency | history.shardIOConcurrency, queue rates | More in-flight DB work per shard | Yes |
| 3. Vertical | Bigger host, faster disk | Everything on that box | Yes |
| 4. More hosts, same DB | Ring membership | Process capacity, up to the primary | Yes |
| 5. Cloning | A second Service + DB | Isolation, not pooled capacity | Yes |
People reach for axis 1 first, and it's the most expensive. Against a disk-bound cluster, "just add more shards" means more concurrent commits on the same slow disk, plus a whole migration. The opposite trap is real too. A small legacy cluster of mine had 4 shards × 1 semaphore at ~10 ms per write, which caps it at about 400 writes/s. At a ~350/s peak, starts went from 46 ms to 1.4 s while PostgreSQL itself was fast, and a second host would only have split the 4 shards 2 + 2. That cluster really did need axis 1: a new cluster at 512 × 4. The rule of thumb is: database saturated → axis 3 on the database; History CPU saturated with the database fine → axis 4; History idle but semaphore_latency high → axis 2; all of those exhausted → axis 1; tenants need a hard wall → axis 5.
When the database is the wall, climb only as high as you must:
- Tune PostgreSQL: autovacuum on the insert-then-delete queue tables (
transfer_tasks,timer_tasks,tasks), checkpoint spacing,random_page_costfor SSD.synchronous_commit = offgives up the last few hundred milliseconds of commits on a crash, so decide that explicitly. - Move PostgreSQL off the Temporal host. This is usually the single highest-value move.
- Get a bigger primary with a faster disk class, then failover-grade HA.
- Beyond that you're changing what you operate. Sharded Postgres-wire databases are not officially supported. Cassandra is Temporal's high-scale backend and scales writes by adding nodes, at the cost of a different skill set. Or hand the problem to Temporal Cloud.
One rung helps every ceiling at once: fewer writes per workflow. Use local activities for short steps, fewer and larger activities, batched signals, and small payloads.
Is Temporal decentralised? No.
There's no peer-to-peer Temporal. There are four real shapes: A, one big Service (pools capacity, soft namespace isolation); B, a Service per tenant or boundary (total isolation, no pooling); C, multi-cluster replication (asynchronous, experimental in OSS); and D, Temporal Cloud's cells, each a self-contained Temporal plus its own database. Many teams think they run A when history gave them B. Several independent installations are "several clusters", not a horizontally scaled fleet, and consolidating them is the drain above.
I treat shape C as a tool, not a topology. It needs enableGlobalNamespace, an identical failoverVersionIncrement, a unique initialFailoverVersion per cluster, and compatible shard counts (equal, or integer multiples). A forced failover can roll progress back and re-run activities. It's how you change an immutable shard count with little downtime, or rehearse DR. The lesson from D carries over to self-hosting: a tenant that needs a hard wall gets its own Service and database. Namespace rate limits are soft isolation, because admitted work still shares one primary.
What I'd tell myself before go-live
- Temporal fails paused, not lost. Committed means safe; uncommitted means retried by the sender.
- The danger is the recovery burst. Don't scale workers, restart History or raise limits during recovery.
- A slow host is worse than a dead one. Alert on per-instance outliers and stop sick hosts.
- You can't delete your way out of a full disk. Alert at 70% and 80%.
- Non-determinism errors pause workflows. Roll back; never mass-terminate.
- Every activity longer than a few seconds heartbeats.
- After every PostgreSQL failover, check for a frozen shard. One sync standby blocks commits when it dies.
- Start with three all-role hosts (for headroom), PostgreSQL on its own HA machines, and one LB address whose idle timeout is over 2 minutes.
- Page on symptoms, warn on mechanisms, and let your benchmark set every threshold.
- Two clusters can't be merged. Move workloads, not data.
- When PostgreSQL is the bottleneck, more Temporal hosts make it worse. Name the axis first.
Next and last in the series: the Temporal Server cheat sheet, the whole series condensed into one decision tree and a page of knobs.