Temporal Frontend and History: The Stateless Door, Its Rate Limits, and the Two-Commit Workflow Step
On this page
- Frontend: one door, no memory
- Routing by formula
- The turnstiles
- Global keys replace, they don't add
- The ×N law, worked
- When a turnstile says no
- Throttling shows up as latency
- N-1: when a node dies, the door shrinks too
- Is it really Frontend?
- Long polls and the load balancer
- History: where workflows actually live
- Two records per workflow
- One writer per workflow
- The outbox: never "save, then call"
- One step, two commits
- The three task queues inside History
- At least once: the ack level and the handshake
- One completion, end to end
- What I'd tell myself before go-live
TL;DR: Frontend is a stateless gRPC tier on
:7233. It authenticates, rate-limits, and forwards each call to the History host that owns the workflow's shard, which it finds with a hash plus a ring lookup and never has to remember. Most of its limits (frontend.rps,frontend.namespaceRPS,frontend.namespaceCount) are per host, so the cluster-wide ceiling isvalue × N. It grows silently when you add a frontend and halves when one of two nodes dies. Theglobal*keys are split÷ Nand replace the per-host value once set. Rejections come back asRESOURCE_EXHAUSTEDwith a cause, and SDKs retry them, so users see slowness long before errors. Behind Frontend, History keeps an append-only event history (history_node) and a mutable-state row (executionsplus side maps) per workflow. Every step costs two commits: events first, then one fenced transaction. That transaction writes the state and the follow-up work as rows intransfer_tasks/timer_tasks/visibility_tasks(a transactional outbox). Those tasks run at least once, and a state check plus the Matching handshake make duplicates harmless. Disk flush latency is the floor under all of it.
The first time Temporal "got slow" on me, nothing was failing. No errors in the app logs, no red on the workers. Starting a workflow just took longer, and schedule-to-start latency crept up in waves. The cause turned out to be a Frontend rate limiter returning RESOURCE_EXHAUSTED while the SDK quietly retried, so nobody ever saw the rejection. The second time, Frontend was idle and History was waiting on PostgreSQL's fdatasync.
Those two services are where most "Temporal is slow" questions end up. The previous post covered why Temporal exists and how a request crosses all four services. This one goes a level deeper on the first two hops: what Frontend does at the door, why its limits behave strangely when the node count changes, and exactly what History writes to PostgreSQL on every workflow step.
Frontend: one door, no memory
Every call from outside the server comes in through Frontend: your app starting workflows and sending signals, every worker long-polling and reporting results, the UI and CLI, and even Temporal's own internal worker. There were two obvious designs, and both are bad. Clients could go straight to the right History or Matching host, but then every SDK would have to track shard ownership and become part of the cluster. Or there could be one smart door that remembers who went where, but then the door holds state, and two copies of it disagree.
Temporal's answer is a door that remembers nothing and works out the destination from a formula. Every copy computes the same answer, so you can add, remove and restart copies freely behind a load balancer. What a frontend keeps in memory (the namespace registry, limiter token buckets, its membership view, gRPC connection pools) can all be rebuilt in seconds. It never holds workflow state, events, tasks, or shard leases.
Internally it's a Go gRPC server. On v1.32 each request runs an interceptor chain in this order: error masking → namespace validation → auth (ClaimMapper / Authorizer) → namespace redirect (multi-cluster) → telemetry → health → long-poll concurrency limit → namespace rate limit → host rate limit → handler. The handler then calls History, Matching, or the visibility store directly.
Two things people get wrong:
- The UI is not Frontend.
temporalio/ui(HTTP on 8080) is a separate process and just another gRPC client. Point itsTEMPORAL_ADDRESSat the load balancer, not at one frontend's IP, or the UI goes down every time that frontend drains for a deploy. - Frontend also serves
AdminServiceon the same port (v1.32):DescribeMutableState,CloseShard, DLQ operations. Put authorization in front of it.
Workers talk only to Frontend. Every poll, completion and heartbeat goes through it, so the worker fleet is usually the largest source of Frontend load, even when the app starts very few workflows. Here's an illustrative fleet: 200 worker processes × 3 task queues × 10 pollers is about 6,000 parked long polls, or 12,000 with both workflow and activity pollers. Each one is a goroutine held open by a frontend. In practice, your worker settings are Frontend settings. Internal traffic (History → Matching, Matching → History, History → History for child workflows, gossip, persistence) never goes through Frontend.
Routing by formula
For anything about one workflow, the frontend resolves the namespace name to its ID, then computes
shardID = farm.Fingerprint32(namespaceID + "_" + workflowID) % numHistoryShards + 1
owner   = historyRing.Lookup(shardID)        → gRPC to owner:7234
If its ring view is stale, the call fails with ShardOwnershipLost, the History client looks up the owner again and retries, and the caller sees a few extra milliseconds. Completions carry the IDs in the task token. Polls work the same way against the Matching ring: the client picks a task-queue partition (/_sys/orders-tq/2) and calls its owner on :7235.
One consequence comes back later: a single hot workflow ID always lands on one shard on one host, however many frontends you run. Workflow IDs only have to be unique within a namespace, which is why the hash includes the namespace ID. Shard ownership gets a post of its own: shards, the ring and shardIOConcurrency.
The turnstiles
Each frontend host has several rate limiters. Here's the analogy, since this is the part that confuses people: each receptionist has a sign saying "max 2,400 visitors per second at this desk". Hire a third receptionist and the building admits 7,200/s, even though nobody touched the sign.
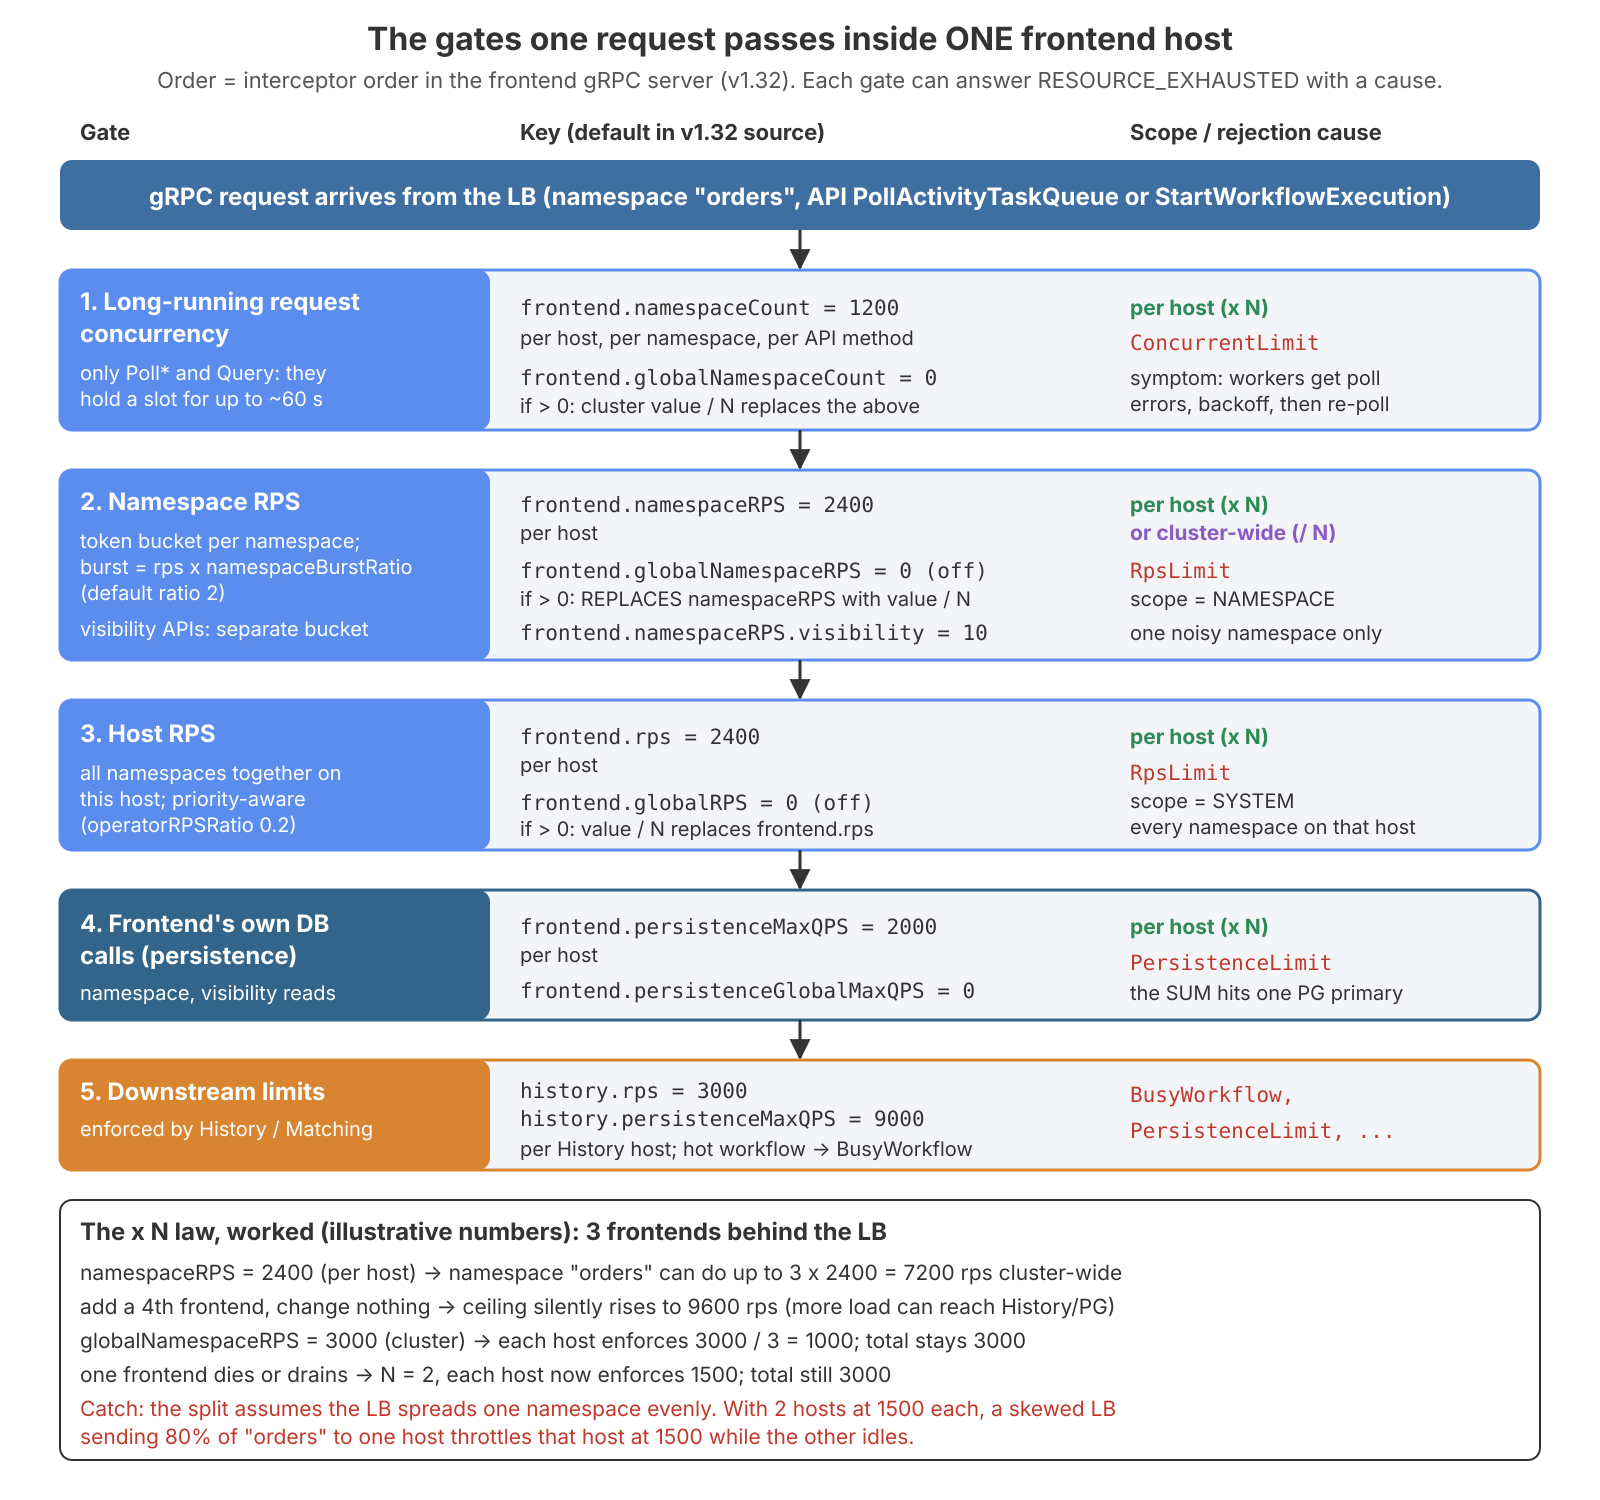
These are the v1.32 source defaults. They move between releases, so check common/dynamicconfig/constants.go at your tag and then your own dynamicconfig/*.yaml.
| Key (default) | Limits | Scope |
|---|---|---|
frontend.rps (2400) | All requests on this host | per host |
frontend.globalRPS (0 = off) | All requests, whole cluster | ÷ N, replaces frontend.rps |
frontend.namespaceRPS (2400) | One namespace on this host | per host |
frontend.globalNamespaceRPS (0 = off) | One namespace, whole cluster | ÷ N, replaces namespaceRPS |
frontend.namespaceRPS.visibility (10) | List/Count/Scan per namespace | per host |
frontend.namespaceCount (1200) | Concurrent Poll*/Query per namespace per API | per host |
frontend.globalNamespaceCount (0 = off) | Same, cluster-wide | ÷ N |
frontend.persistenceMaxQPS (2000) | This frontend's own DB calls | per host |
history.rps (3000) / history.persistenceMaxQPS (9000) | Into one History host / its DB calls | per History host |
On v1.32 the rule is simple: if the key name contains global, it's cluster-wide and divided among live, non-draining members. Everything else under frontend.* is per host.
Global keys replace, they don't add
I'd read somewhere that frontend.globalNamespaceRPS "only applies with more than one frontend". That's wrong for current source (common/quotas/calculator/cluster_aware_quota_calculator.go, v1.32):
if clusterLimit > 0 && memberCounter != nil {
    if clusterSize := memberCounter.AvailableMemberCount(); clusterSize > 0 {
        return float64(clusterLimit) / float64(clusterSize)
    }
}
return float64(instanceLimit)
With one frontend, the host enforces the global value ÷ 1. Once the global key is set it replaces the per-host value; it isn't an extra cap. And since draining frontends aren't counted, every host's share changes when a frontend joins, leaves or starts shutting down.
The ×N law, worked
Illustrative numbers, namespace orders:
| Situation | Effective limit |
|---|---|
3 frontends, namespaceRPS: 2400 | up to 7,200/s cluster-wide |
| Add a 4th, change nothing | up to 9,600/s, and more load reaches History and PostgreSQL |
3 frontends, globalNamespaceRPS: 3000 | 1,000/s per host → 3,000/s total |
| One of them dies or drains | 1,500/s per host → still 3,000/s |
Same, LB sends 80% of orders to one host | that host rejects at 1,500/s → RpsLimit below 3,000/s total |
Decide what you mean before you set a limit. "Protect the backend at X/s" means the global key set to X. "Each host can handle X/s of CPU" means the per-host key, plus checking that History and PostgreSQL can absorb X × N.
# dynamicconfig (illustrative): cap one noisy namespace cluster-wide
frontend.globalNamespaceRPS:
  - value: 3000
    constraints:
      namespace: "orders"
The trap goes both ways. Limits tuned for 2 frontends get carried to 6 unchanged, the total triples, and PostgreSQL commit latency climbs. Or a global limit gets copied from a big cluster to a small one and quietly caps every namespace. Whenever the frontend count changes, re-read every per-host key. The host_rps_limit and namespace_host_rps_limit gauges show what each host is enforcing right now, after the ÷ N maths.
When a turnstile says no
The interceptor rejects the call before doing any work and returns gRPC RESOURCE_EXHAUSTED. The cause is a label on service_errors_resource_exhausted, and it names the gate that said no:
resource_exhausted_cause | Meaning |
|---|---|
RpsLimit, scope NAMESPACE | This namespace went over its per-host (or global ÷ N) budget on this host |
RpsLimit, scope SYSTEM | This host went over frontend.rps across all namespaces |
ConcurrentLimit | Too many concurrent polls/queries for one namespace + API on this host |
BusyWorkflow | One workflow is getting updates faster than History can apply them |
PersistenceLimit | A role hit its own *.persistenceMaxQPS and is throttling itself |
SystemOverloaded | The server is protecting itself |
Newer versions add more causes (CircuitBreakerOpen, ApsLimit, OpsLimit), so grep your own /metrics for the exact values.
Throttling shows up as latency
The Go SDK retries RESOURCE_EXHAUSTED. Client calls back off from 200 ms (coefficient 2) until the context deadline, which defaults to 60 s. Worker polls back off from 1 s up to 10 s, then poll again. Other SDKs retry too, with different intervals.
So when a limiter fires, StartWorkflowExecution just gets slower, and the caller only sees an error if throttling outlasts the deadline. Workers stop polling for 1–10 s at a time, and schedule-to-start latency rises while nothing looks broken. The app logs won't show it. The metric will:
sum by (instance, resource_exhausted_cause) (
  rate(service_errors_resource_exhausted{service_name="frontend"}[5m]))
N-1: when a node dies, the door shrinks too
Because most limits are per host, losing a node on a small cluster loses work capacity and limit capacity together:
2 frontend hosts × namespaceRPS 2400 = 4,800/s for the namespace
1 host dies → 1 × 2400               = 2,400/s   ← the cluster's limit HALVES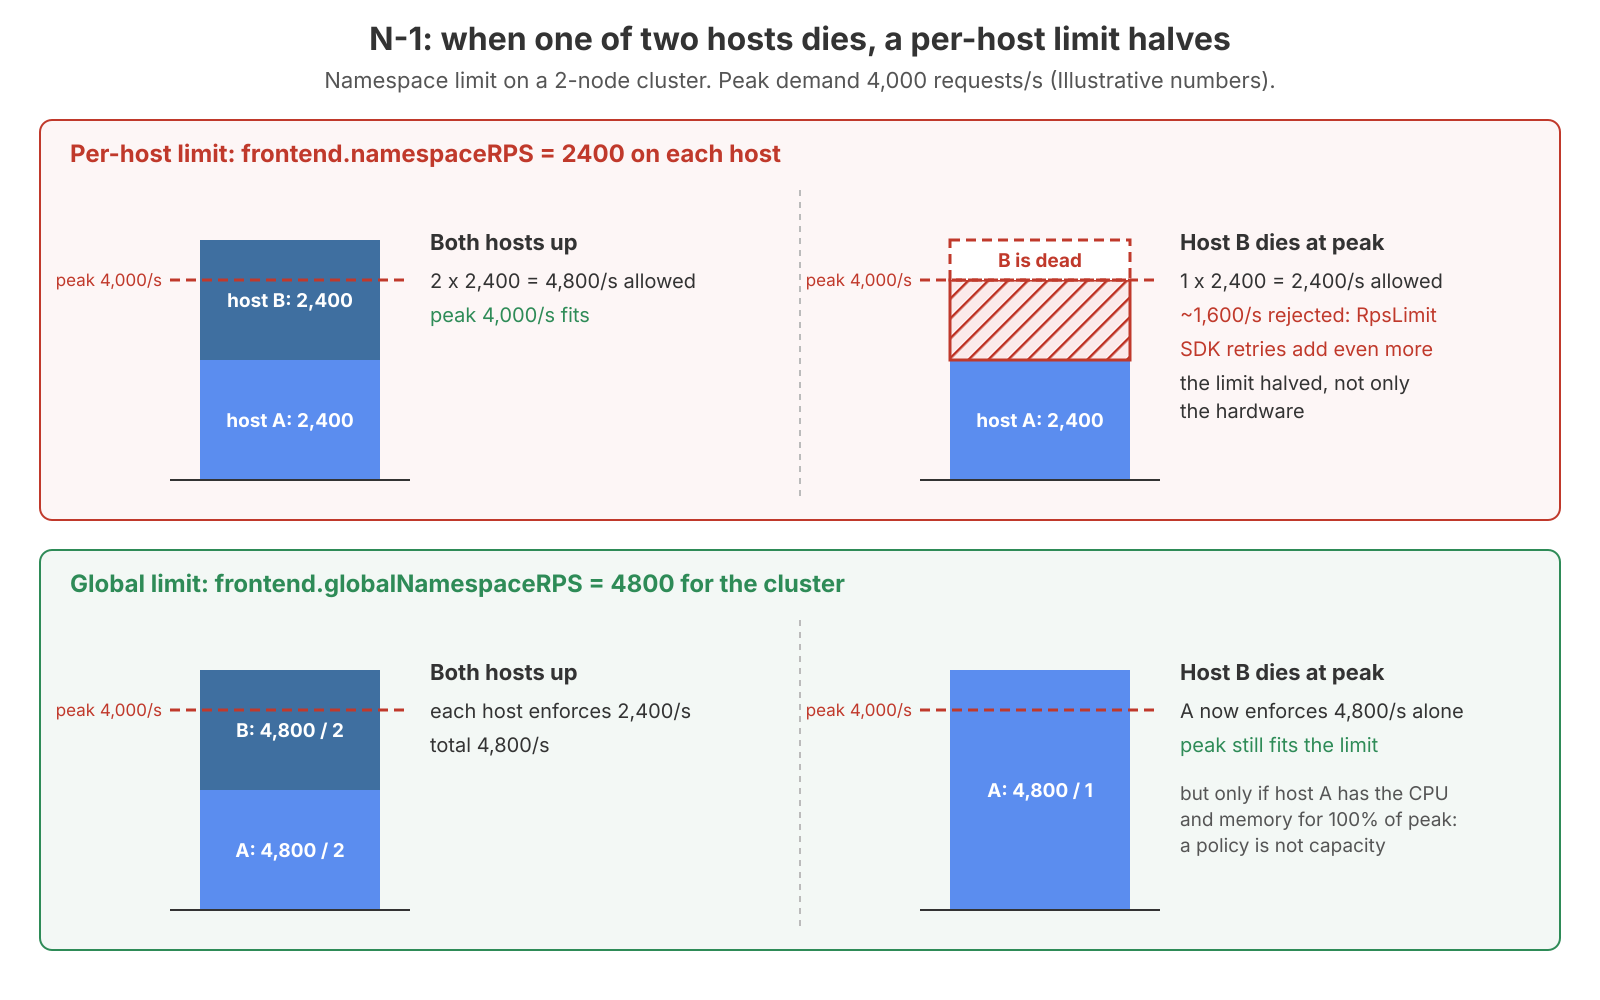
This is the scenario I worry about most on a two-node cluster where every node runs every role. Say per-host namespaceRPS is set just above half of peak, and node B dies at peak:
- B's shards move to A. Those workflows pause for a few seconds, and A's caches are cold, so it does extra DB reads.
- Every client and worker reconnects to A, which now gets 100% of peak.
- A's limit covers about half of that, so roughly half the requests get
RpsLimit. - The SDKs retry, which means more requests and more rejections. Retry amplification.
- Worker polls count against the same limits, so dispatch slows and schedule-to-start rises everywhere.
- Users see everything slow, with no errors. When B comes back, the backlog drains in a burst.
There are two fixes. Size per-host limits so one host alone can carry peak, or switch to the global* keys, which re-divide a fixed number among the survivors. Either way, the surviving host has to have the CPU and memory for 100% of the load. A global limit keeps the policy constant; it doesn't create capacity. Node loss is covered properly in the failure drills post.
Is it really Frontend?
"Overloaded" can mean two different things, and they need opposite fixes. A limiter saying no is policy: RESOURCE_EXHAUSTED with a cause, low CPU, and a fix that's a limit change, not hardware. Real saturation means no limiter fires, but non-poll p99 rises for every namespace at once, CPU sits near the container limit, goroutines and GC time climb, and you get DEADLINE_EXCEEDED. If the LB health check then times out, the LB ejects the host, and that's how one hot frontend becomes a cascade.
Frontend latency also includes the downstream call, so check what's behind it before you blame it:
| Frontend p99 | History p99 | Frontend CPU | Verdict |
|---|---|---|---|
| high | high | low | History or PostgreSQL. More frontends will not help |
| high | normal | high | Frontend is saturated. Add frontends or CPU |
normal, many RpsLimit | normal | low | Policy. Raise the limit or go global; don't add hosts |
normal, many ConcurrentLimit | normal | low/medium | Too many pollers. Fewer per worker, or raise namespaceCount |
The first row matters most: adding frontends never adds shards and never makes History or PostgreSQL faster. numHistoryShards is fixed at cluster creation and stored in cluster metadata. Frontends only read it, and on a mismatch v1.32 logs a warning and uses the stored value. If History is the bottleneck, more frontends make it worse, because they forward more load to the same shards. They also open more DB connections. If persistence.datastores.*.sql.maxConns is unset, Go's default is unlimited.
Search gets its own tiny limit for a reason. Workflow calls are cheap point lookups. Visibility calls filter and sort executions_visibility, and one auto-refreshing UI page can load the same PostgreSQL every workflow step depends on. So frontend.namespaceRPS.visibility defaults to 10 per host per namespace (v1.32, experimental). The design rule behind it: a dashboard must never be able to slow down workflows. The flip side is that a few people refreshing a busy UI can trip it.
Long polls and the load balancer
Matching holds a poll for up to matching.longPollExpirationInterval (default 1 min), and the Go SDK's poll timeout is 70 s. gRPC runs over HTTP/2, where many calls share one TCP connection, so an L4 balancer balances connections, not calls. To keep that spread fair, Frontend sends a GOAWAY after frontend.keepAliveMaxConnectionAge (5 min ± 10% jitter) and gives in-flight calls a …Grace of 70 s. That periodic reconnect is what moves connections onto a frontend you just added.
The LB has to:
- speak HTTP/2 end to end (or pass TCP straight through);
- have idle/stream timeouts above 70 s, ideally above max-age + grace (about 6.5 min), e.g. nginx
grpc_read_timeout 600s; - health-check with
grpc.health.v1.Health/Check, which turnsNOT_SERVINGat the start of shutdown; - not rewrite
RESOURCE_EXHAUSTED, and not be DNS round-robin, since clients cache one address and stick to it.
Two LB failures I've learned to look for. With an idle timeout of 60 s and polls held 60 s, some polls die at the boundary, workers log Unavailable, and schedule-to-start rises in waves. With an L4 LB and no connection max-age, a newly added frontend #4 gets almost no traffic for hours. Fix the LB before adding frontends.
Shutdown drains are opt-in. On stop, a frontend marks itself draining (which also raises the other hosts' global-limit shares), fails health checks for frontend.shutdownFailHealthCheckDuration, then gracefully stops for up to frontend.shutdownDrainDuration. Both default to 0, so every deploy cuts parked polls unless you set them:
frontend.shutdownFailHealthCheckDuration:
  - value: 15s     # >= LB health-check interval x unhealthy threshold
frontend.shutdownDrainDuration:
  - value: 70s     # >= one long-poll cycle
terminationGracePeriodSeconds (or systemd TimeoutStopSec) has to be longer than the two added together.
The Frontend queries I actually use:
# Request rate per host: is the LB spreading load? (max/min > 1.5 = LB problem)
sum by (instance) (rate(service_requests{service_name="frontend"}[5m]))

# p99 of NON-poll calls (polls are slow by design)
histogram_quantile(0.99,
  sum by (le, operation) (rate(service_latency_bucket{service_name="frontend", operation!~".*Poll.*"}[5m])))

# Headroom against the host limit (sustained > 0.8 = next spike hits RpsLimit)
sum by (instance) (rate(service_requests{service_name="frontend"}[1m]))
  / on (instance) max by (instance) (host_rps_limit{service_name="frontend"})
Those thresholds are rules of thumb; Temporal publishes no official ones. Names follow v1.32, and your exporter may add suffixes. On the worker side, temporal_long_request_failure shows failing polls. The SDK metrics post covers exporting those.
History: where workflows actually live
Frontend forwards and Matching hands out jobs. History is the only service that decides and remembers. When a worker reports that sendEmail finished, something has to write that fact down durably before saying OK, wake the workflow so it decides the next step, keep its timers firing even when no worker is running, and put concurrent inputs (a signal and this completion) into one order that every replay will see. Workers can't do that because they're stateless, and PostgreSQL can't do it alone because it doesn't run timers. History is the layer that turns a database into a durable state machine.
History also does retention deletion. That isn't the internal worker's job. When a workflow closes, History creates a DeleteHistoryEvent timer task on the workflow's shard, and the shard's timer queue deletes the execution when retention expires. Because that timer is created at close time, a retention change only affects workflows that close afterwards. Shorten retention from 30 days to 7 to save disk, and a week later the database is the same size. Even after the deletes run, PostgreSQL needs vacuum, and maybe pg_repack, to give the space back.
Two records per workflow
For every workflow, History keeps an event history and a mutable state. If the analogy helps, think of a bank statement and a balance. The history is append-only and is the truth: workers replay it, and the UI shows it.
#1 WorkflowExecutionStarted     input: {invoiceId: 42}
#2 WorkflowTaskScheduled
#3 WorkflowTaskStarted
#4 WorkflowTaskCompleted
#5 ActivityTaskScheduled        sendEmail
#6 ActivityTaskStarted
#7 ActivityTaskCompleted        result: {messageId: "abc"}
Mutable state holds only what is pending right now (next event ID, pending activities and timers, the current workflow task). History needs it to answer "is activity 5 still pending?" without decoding the whole history on every request.
| Event history | Mutable state | |
|---|---|---|
| Changes | Only appended | Rewritten on every state transition |
| PostgreSQL | history_node (event batches), history_tree (branches, for reset) | executions (next_event_id, db_record_version), current_executions, activity_info_maps, timer_info_maps, child_execution_info_maps, signal_info_maps, buffered_events, … |
| Read by | Workers (replay), UI | Only History |
If they disagree, the history wins and the state can be rebuilt from it. To answer "what is this workflow waiting for?", compare temporal workflow show (the history) with temporal workflow describe (pending activities with attempt and last failure, history length).
Retries don't grow the history. ActivityTaskStarted is written only when the activity completes, fails or times out. Until then, "started" lives in mutable state, and so do the attempt counter and backoff, which timer tasks drive. An activity that succeeds on attempt 10 adds exactly three events. Retries still cost state transitions, just not history length. History length is capped anyway, at around 51,200 events or 50 MB on recent versions (limit.historyCount.error / limit.historySize.error), and the workflow is terminated when it hits the cap. Long-runners need continue-as-new, which the determinism post covers.
One writer per workflow
Every update is "read state at nextEventID = N, compute events N, N+1…, write them". Two writers at once would both produce event N. Temporal blocks this at three levels: a per-workflow lock in the History process (lock_latency), a conditional update on executions.db_record_version / next_event_id in the row, and a single owner per shard enforced by a range_id check in every write transaction.
The price is a speed limit per workflow. A storm of signals to one workflow is applied one transaction at a time, on one lock, one shard, one host, and past a point you get RESOURCE_EXHAUSTED with cause BusyWorkflow. More shards don't help, because one ID always hashes to one shard. Here's an illustrative case: one order-sync-global workflow taking 300 signals/s, with lock_latency high and the shard semaphore fine. Fan it out (order-sync-{hash(orderID) % 32}) or batch the signals. Also do the arithmetic: 300 signals/s is about a million events an hour, far past the history cap.
There's a second lock in the path, the shard IO semaphore (history.shardIOConcurrency, default 1), which limits concurrent DB saves for an entire shard. Waiting for it shows up as semaphore_latency{operation="ShardInfo"}, and the save itself as persistence_latency. If users are waiting but the DB and the workflow lock both look fast, look at the semaphore in between. That lock and the incident that taught me about it are the next post's subject.
The outbox: never "save, then call"
An activity finishes. History must append events, update state, and get a workflow task onto Matching so a worker wakes up. Save-then-call has a crash window: state says "workflow task scheduled", Matching never heard of it, and the workflow is stuck forever. Call-then-save has the opposite window: a worker gets a task neither record knows about. PostgreSQL and Matching are two systems, and no single step updates both.
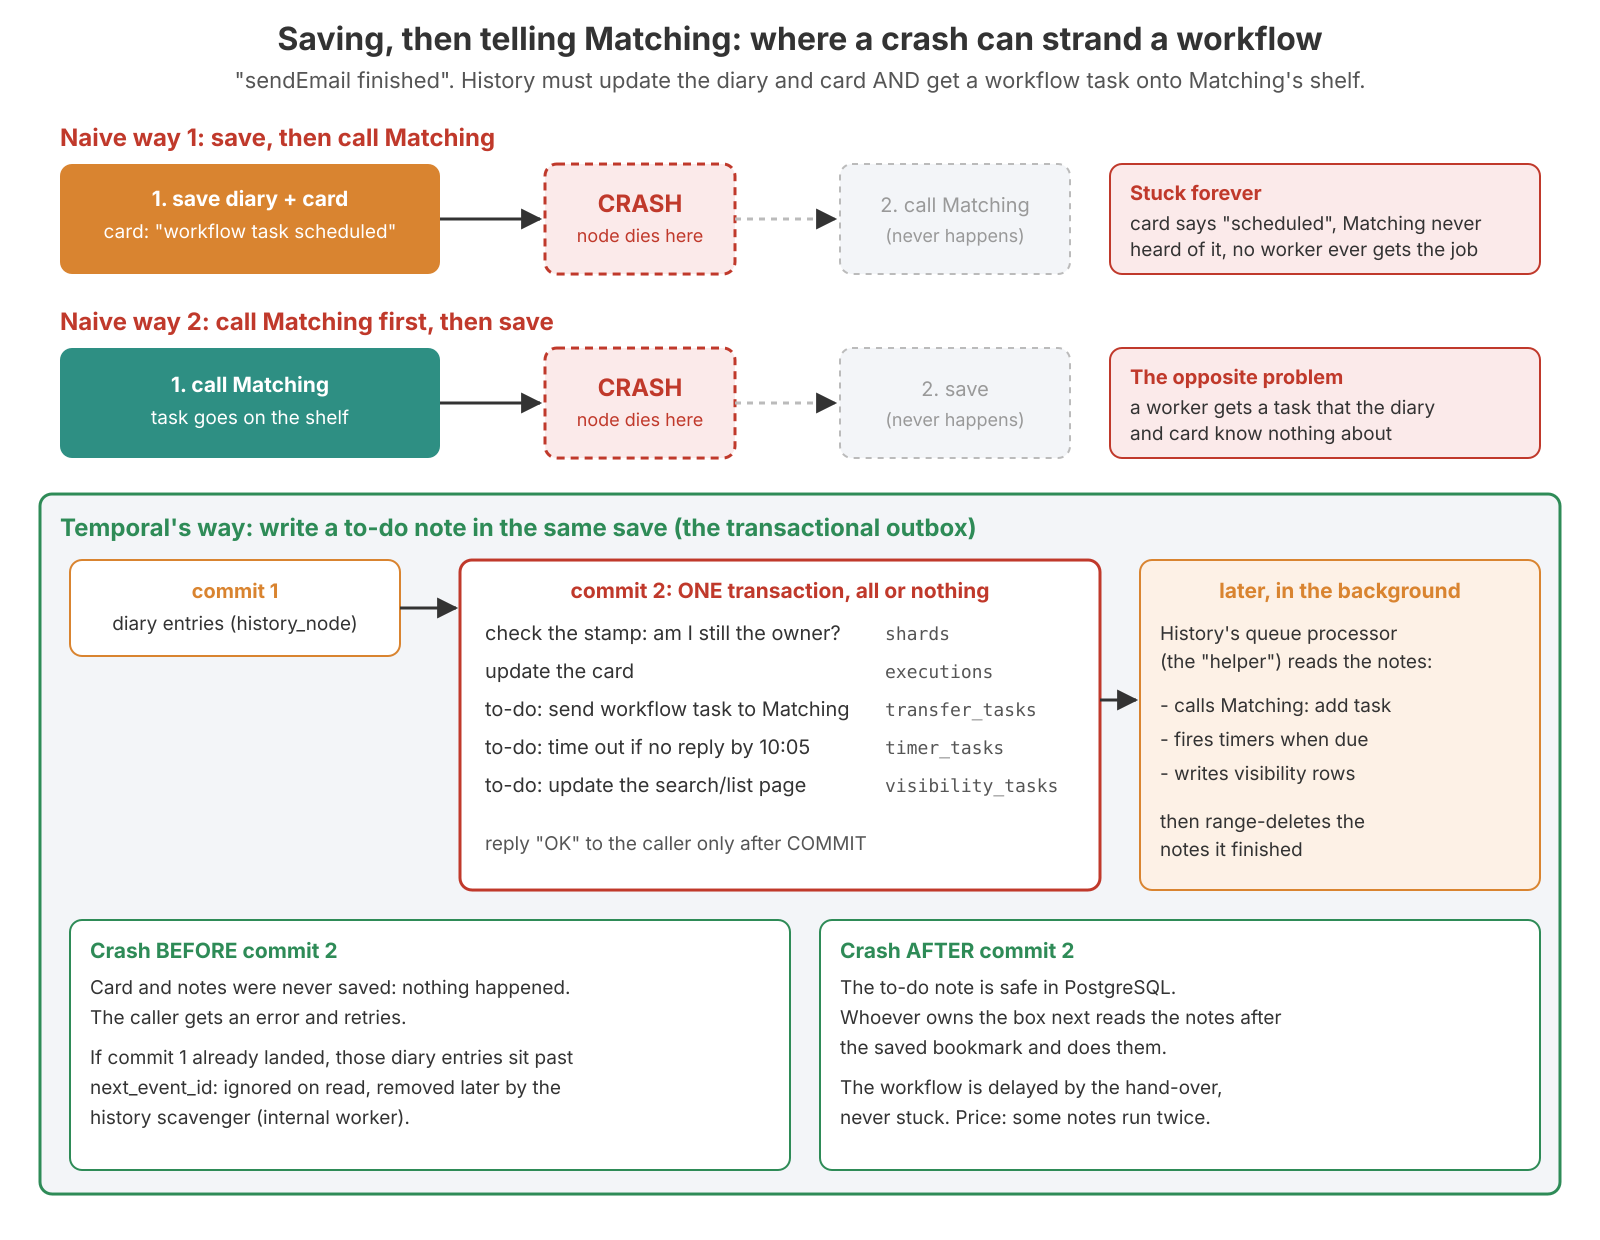
So History never calls Matching inline. It writes the call as a row (a history task) in the same transaction as the state update, and a background queue processor in History carries it out later. If it crashes before the commit, nothing happened and the caller retries. If it crashes after, the row is in PostgreSQL, and whoever owns the shard next finds it and does it. The workflow is delayed by the hand-over, but it never gets stuck.
One step, two commits
The notes I learned from said "one transaction: events + state + tasks". The v1.32 source (common/persistence/sql/execution.go) does it slightly differently, and the difference matters for latency:
-- (A) events first, OUTSIDE the state transaction (autocommit: 1 commit)
INSERT INTO history_node (shard_id, tree_id, branch_id, node_id, prev_txn_id, txn_id, data, data_encoding)
VALUES (...) ON CONFLICT (shard_id, tree_id, branch_id, node_id, txn_id) DO UPDATE SET ...;

-- (B) the state transaction (1 commit)
BEGIN;
  SELECT range_id FROM shards WHERE shard_id = $1 FOR SHARE;          -- fencing: must equal my range_id
  SELECT db_record_version, next_event_id FROM executions
   WHERE shard_id=$1 AND namespace_id=$2 AND workflow_id=$3 AND run_id=$4 FOR UPDATE;
  UPDATE executions SET data=..., state=..., next_event_id=..., db_record_version=... WHERE ...;
  INSERT INTO activity_info_maps / timer_info_maps / ...  (upserts);  DELETE FROM ..._maps (removals)
  INSERT INTO transfer_tasks / timer_tasks / visibility_tasks (...);   -- the outbox
COMMIT;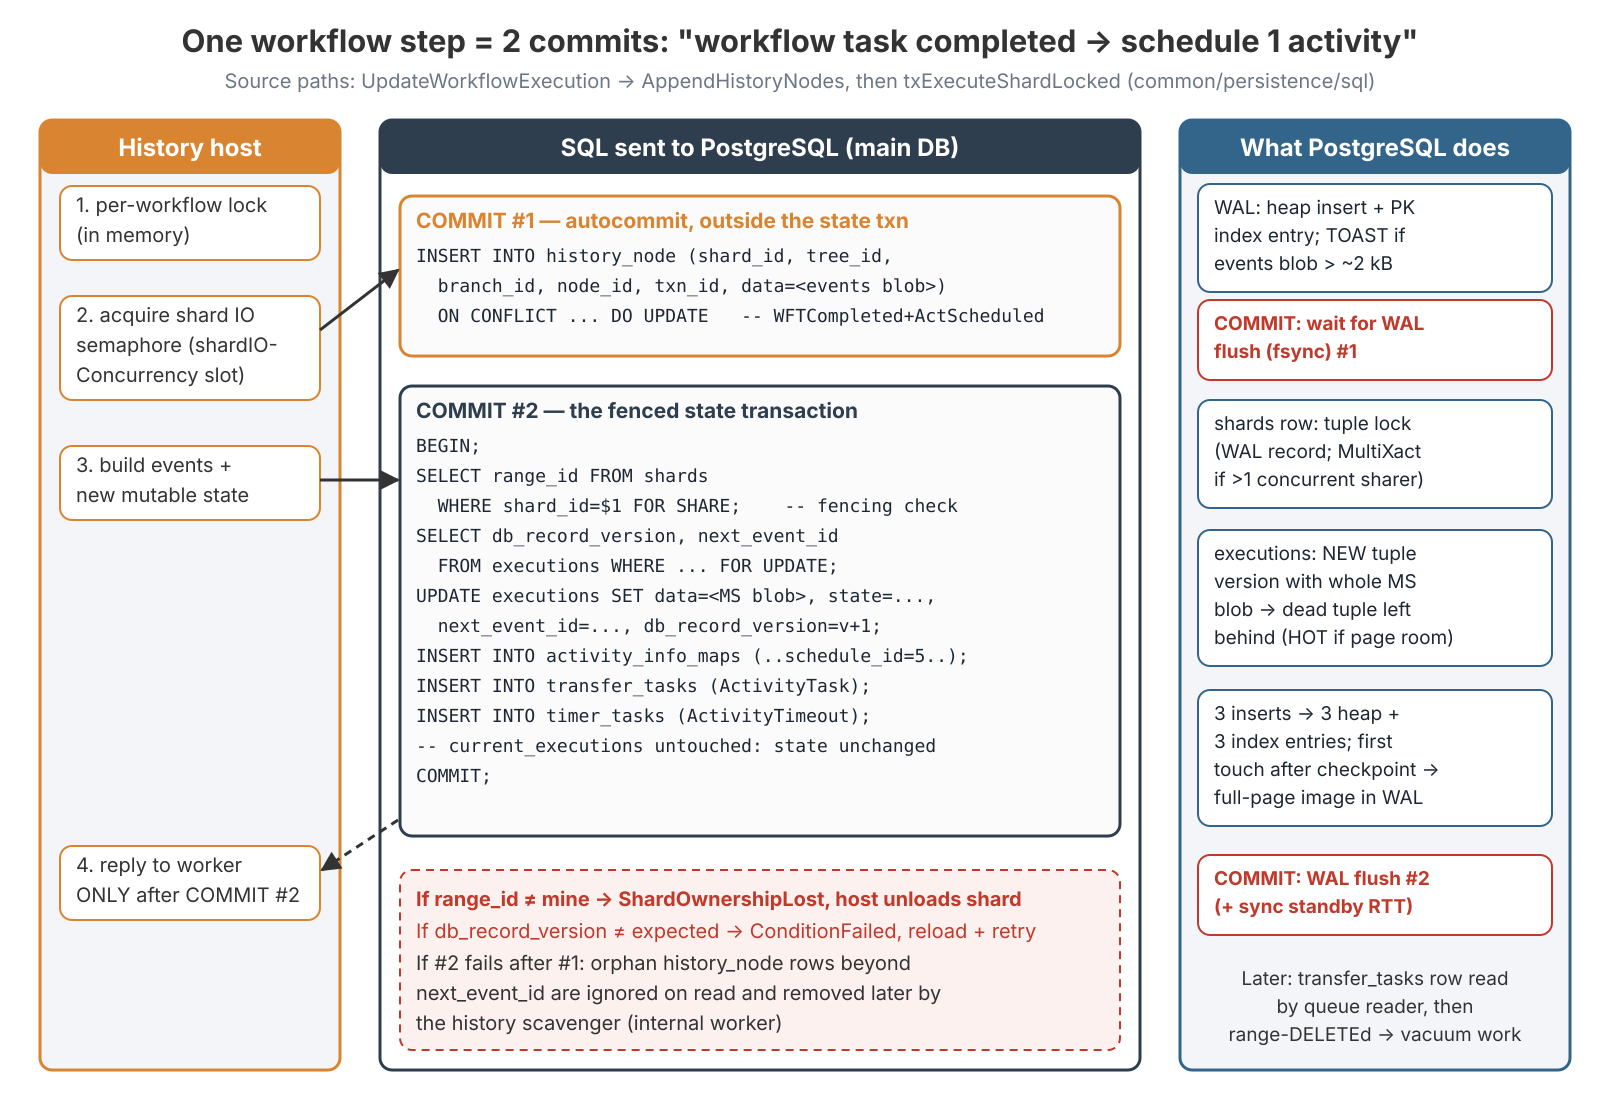
- Fencing is a row lock plus a comparison. If
shards.range_idisn't the value this host got when it acquired the shard, the transaction aborts withShardOwnershipLostErrorand the host unloads the shard. Workflow writes take that rowFOR SHARE, so several can run together (that's whatshardIOConcurrency > 1allows). - The workflow row is
FOR UPDATEplus a version check. A mismatch means "my cached state is stale", so History reloads and retries. - Events go first. If (B) fails after (A), the orphan
history_noderows sit beyondnext_event_id, are ignored on read, and are cleaned up later by the history scavenger. Mutable state decides which events count.
Temporal replies only after (B) commits. With PostgreSQL's default synchronous_commit = on, each COMMIT waits for a WAL flush to the primary's disk, and for the standby too under synchronous replication:
min step latency ≈ RTT(app↔DB) × statements + WAL flush (A) + WAL flush (B)
                   [+ 2 × sync-replica round trip]
illustrative:      1 ms × 8 + 2 × 2 ms ≈ 12 ms per step, before any queueing
That's why one workflow can't do thousands of steps per second, however big the cluster is. It's also why persistence_latency{operation="UpdateWorkflowExecution"} rising while PostgreSQL CPU stays low points at the disk: network block storage, or a burst-credit volume that's run out. Confirm with pg_stat_wal / pg_stat_io or iostat on the WAL device. More History hosts won't fix it. Group commit helps, since concurrent commits share a flush and throughput climbs with concurrency until the WAL device saturates.
Some operators set synchronous_commit = off to take the flush out of the path. On a PostgreSQL crash, the last few wal_writer_delay intervals of acknowledged commits can vanish, which for Temporal means a start, signal or completion the caller was told about never happened. That's a risk decision with an owner, not a tuning knob. What all this does to WAL and autovacuum is in the persistence post.
The three task queues inside History
Each shard has its own History task queues, keyed by shard_id:
| Queue | Table | Holds |
|---|---|---|
| Transfer | transfer_tasks | Do now: push a workflow/activity task to Matching, start a child, signal another workflow |
| Timer | timer_tasks | Do at time T: sleep(1h), activity/workflow timeouts, retry backoff, retention deletion |
| Visibility | visibility_tasks | Update the search/list store |
These are not the task queues your workers poll. Those belong to Matching, covered in the Matching post. When someone says "the queue is backed up", ask which one they mean. A backed-up History queue shows up as task_latency_queue and rows piling up in transfer_tasks / timer_tasks.
Each processor reads only its own shard's rows past its ack level, which is a cheap primary-key range scan. It checks each task against mutable state, then range-deletes finished rows. That makes these tables INSERT-then-DELETE churn, so autovacuum matters. Idle shards still cost something. Each queue polls at least every history.transferProcessorMaxPollInterval (1 min, jittered), so 4,096 idle shards means several thousand small queries a minute with zero traffic.
Timers fire with no workers running. History executes timer tasks itself. If the shard's owner is down, a timer fires late, but it does fire, because the next owner finds it in the table.
At least once: the ack level and the handshake
Each processor keeps an ack level ("everything up to task 500 is done") and persists it to the shards row only now and then. On v1.32 that's at most every history.shardUpdateMinInterval, which defaults to 5 min (the notes I learned from said "every few seconds"), plus on shard acquire and release. After a crash, the new owner restarts from the last saved ack level and re-runs whatever ran in between.
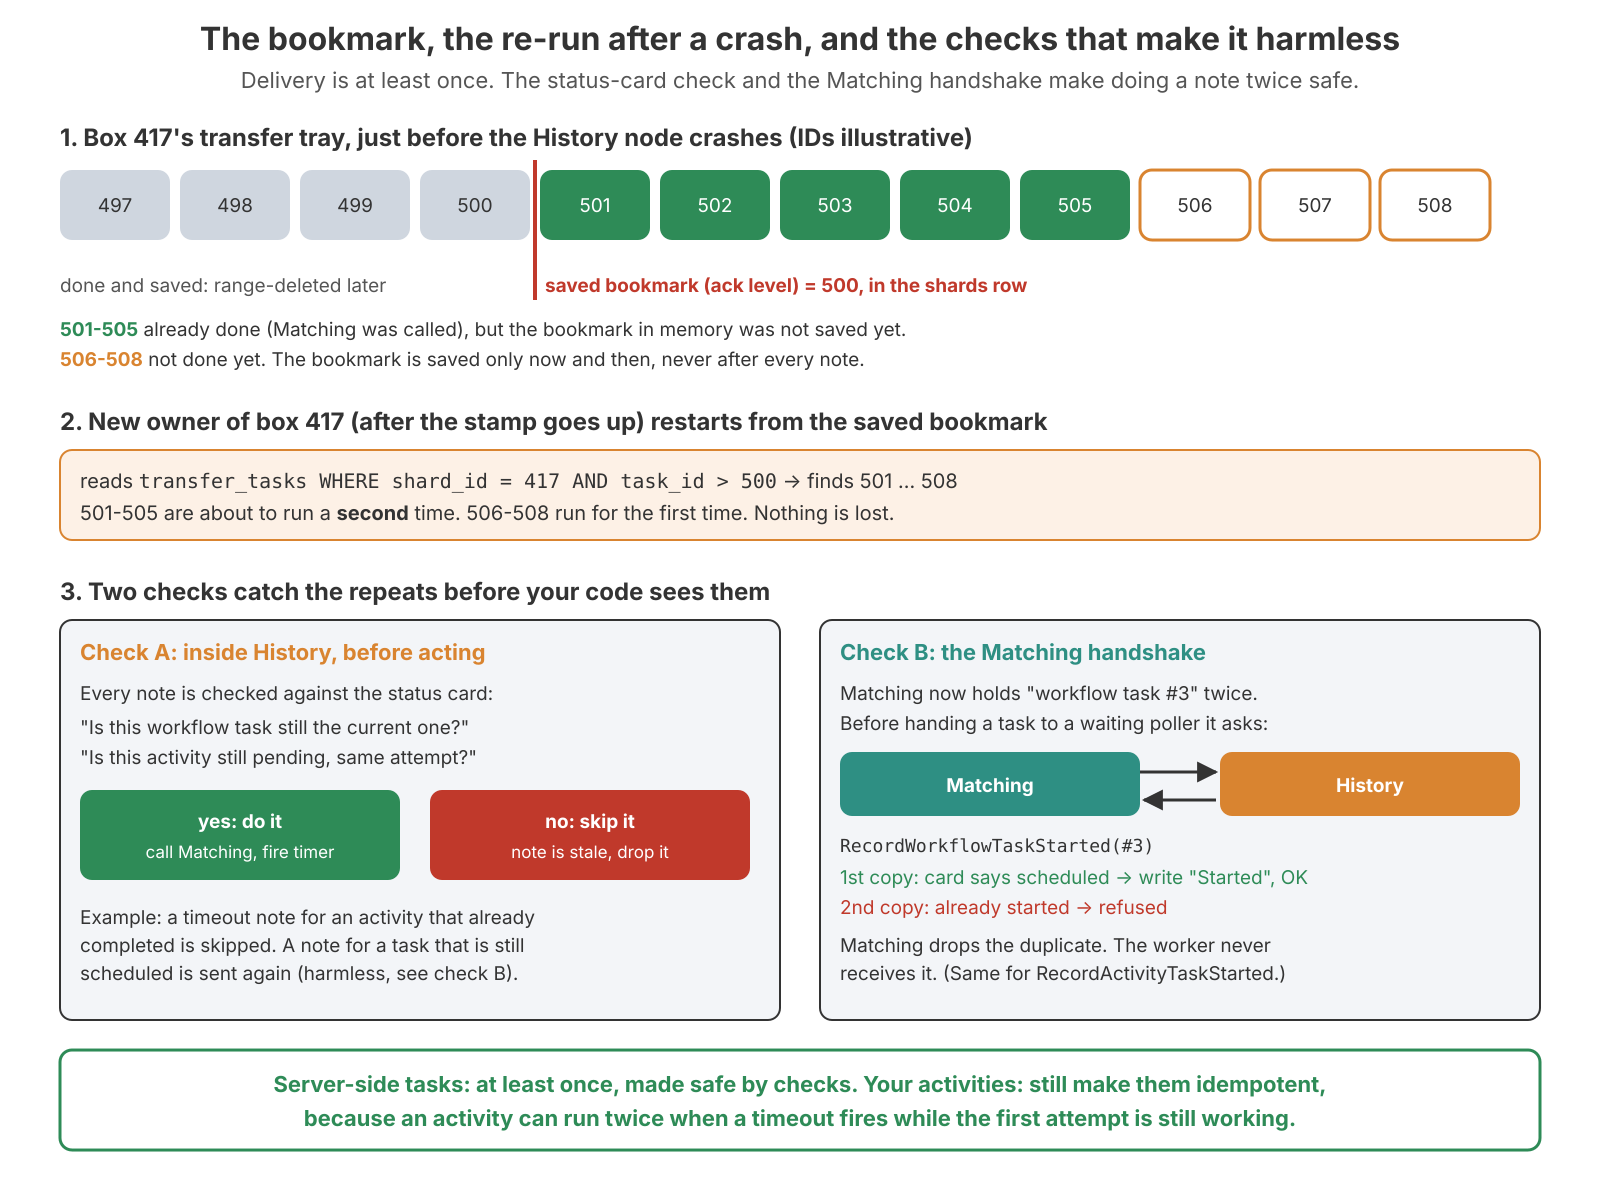
Two checks make the re-runs harmless. First, inside History, every task is checked against mutable state before it runs ("is this activity still pending, same attempt?"), and stale tasks are dropped. Second, the Matching handshake: before handing a task to a poller, Matching calls RecordWorkflowTaskStarted (or RecordActivityTaskStarted) on History, effectively asking "may I start task #3?". The first copy is allowed and "started" gets recorded. A second copy is refused and dropped, so the worker never sees it. The handshake also hands the worker the current attempt number. tdbg shard describe --shard-id <n> shows a shard's persisted queue states.
Server-side at-least-once doesn't make your activities exactly-once. Take an activity with a 5-minute start-to-close timeout that actually takes 6. At minute 5 a timer task records the timeout and, with the default unlimited retry policy, schedules attempt 2. At minute 6 attempt 1's "done" fails the state check and is thrown away, but attempt 2 may already be running, so the email goes out twice. The fix: set start-to-close above the real duration, heartbeat so the activity learns it timed out, and use idempotency keys. The timeouts post covers all four clocks.
One completion, end to end
 1. Frontend: turnstiles; shard = hash(namespaceID_workflowID); forward to owner
 2. History:  per-workflow lock → read state → "is this attempt still pending?"
 3.           build events + new state + transfer task "add workflow task"
 4.           shard IO semaphore → commit A (history_node) → commit B (fence, state, task)
 5.           release, reply OK ──► Frontend ──► worker
    -- later, in the background --
 6.           queue processor reads the task → Matching.AddWorkflowTask
 7. Matching → History: RecordWorkflowTaskStarted   (check + another state transition)
 8. a parked poller gets the workflow task, replays, decides the next step
Count the flushed commits: two at step 4, one more at step 7, and then the worker's reply to that workflow task is another full step with two more. One "simple" activity completion is several fsync'd commits. That's why History plus PostgreSQL is almost always where Temporal gets slow, and why the Frontend limits above exist to protect them.
If a signal arrives while a worker is mid-decision, History doesn't start a second workflow task, because two workers deciding at once could make conflicting decisions. The event is buffered in mutable state (buffered_events, inside the same state transaction), then flushed into the history right after WorkflowTaskCompleted, and a new workflow task is scheduled. That's why in temporal workflow show a signal can appear after the task it arrived during, which answers every "my signal took effect late" question I've had.
The History-side signals worth a panel:
histogram_quantile(0.99, sum by (le, instance) (rate(lock_latency_bucket{service_name="history"}[5m])))      # hot workflow
histogram_quantile(0.99, sum by (le, instance) (rate(semaphore_latency_bucket{operation="ShardInfo"}[5m])))  # busy shard
histogram_quantile(0.99, sum by (le, operation) (rate(persistence_latency_bucket{service_name="history"}[5m])))  # DB / disk
histogram_quantile(0.99, sum by (le, operation) (rate(task_latency_queue_bucket{service_name="history"}[5m]))) # queues keeping up?-- Timer tasks already overdue (should be near 0; a pile = timers firing late)
SELECT shard_id, count(*) AS overdue
FROM timer_tasks WHERE visibility_timestamp < now() - interval '1 minute'
GROUP BY shard_id ORDER BY overdue DESC LIMIT 10;Run counts like that on a replica or at a quiet time.
What I'd tell myself before go-live
- Frontend computes, it doesn't remember. Point everything at the LB, the UI included, and make the LB HTTP/2 with timeouts well above 70 s. Set both shutdown durations, because they default to 0.
- Most Frontend limits are per host. The total is
value × N: it grows when you add a host and halves when one of two dies.global*keys divide by live members and replace the per-host value. - Size for N-1. Either per-host limits that one node can carry alone, or global limits plus a node with the CPU for 100% of peak.
- Throttling looks like slowness. Read
service_errors_resource_exhaustedby cause, not the app logs. Fix policy rejections by changing limits, not by adding hosts. - More frontends never add shards or speed up History/PostgreSQL, and they can make a History bottleneck worse.
- Every workflow step is two fsync'd commits.
persistence_latencyrising while PG CPU stays low means the disk. - Never "save, then call". The outbox makes tasks run at least once, and the state check and handshake make duplicates harmless. Activities still need to be idempotent.
- One workflow is one lock on one shard. A hot workflow needs a redesign, not more shards.
- Retention changes only apply to workflows that close afterwards.
Next in the series: History shards, the ring, range_id fencing and shardIOConcurrency, on why the shard count is forever and which of the two locks is actually slow.